
Tops, Bottoms, Switches: One Last Look at All The Survey Data
Hello and welcome to our final journey into the annals of data collected by me, from you, regarding your feelings about the sexual terms top / bottom / switch. We’ve already discussed:
- What you mean when you say “bottom” or “sub”
- What you mean when you say “top” or “dom” (which also included a brief gender conversation)
- What you mean when you say “switch”
- Sub-identities like “pillow princess,” “service top,” “bratty bottom,” etc.
- 55 Very Deep Thoughts About Your Sex Life You Shared With Us On Our Recent Sex Survey
- A+ Roundtable: Our Bottoms, Our Tops, Our Switches, Ourselves
Now we’re going to look at the survey responses as a whole, and how various other identities, practices, lifestyle situations and relationships intersect with the identities I decided to really really demolish over the past few months.
![]()
Just a Reminder
One last time with feeling, this is how the numbers shook out:
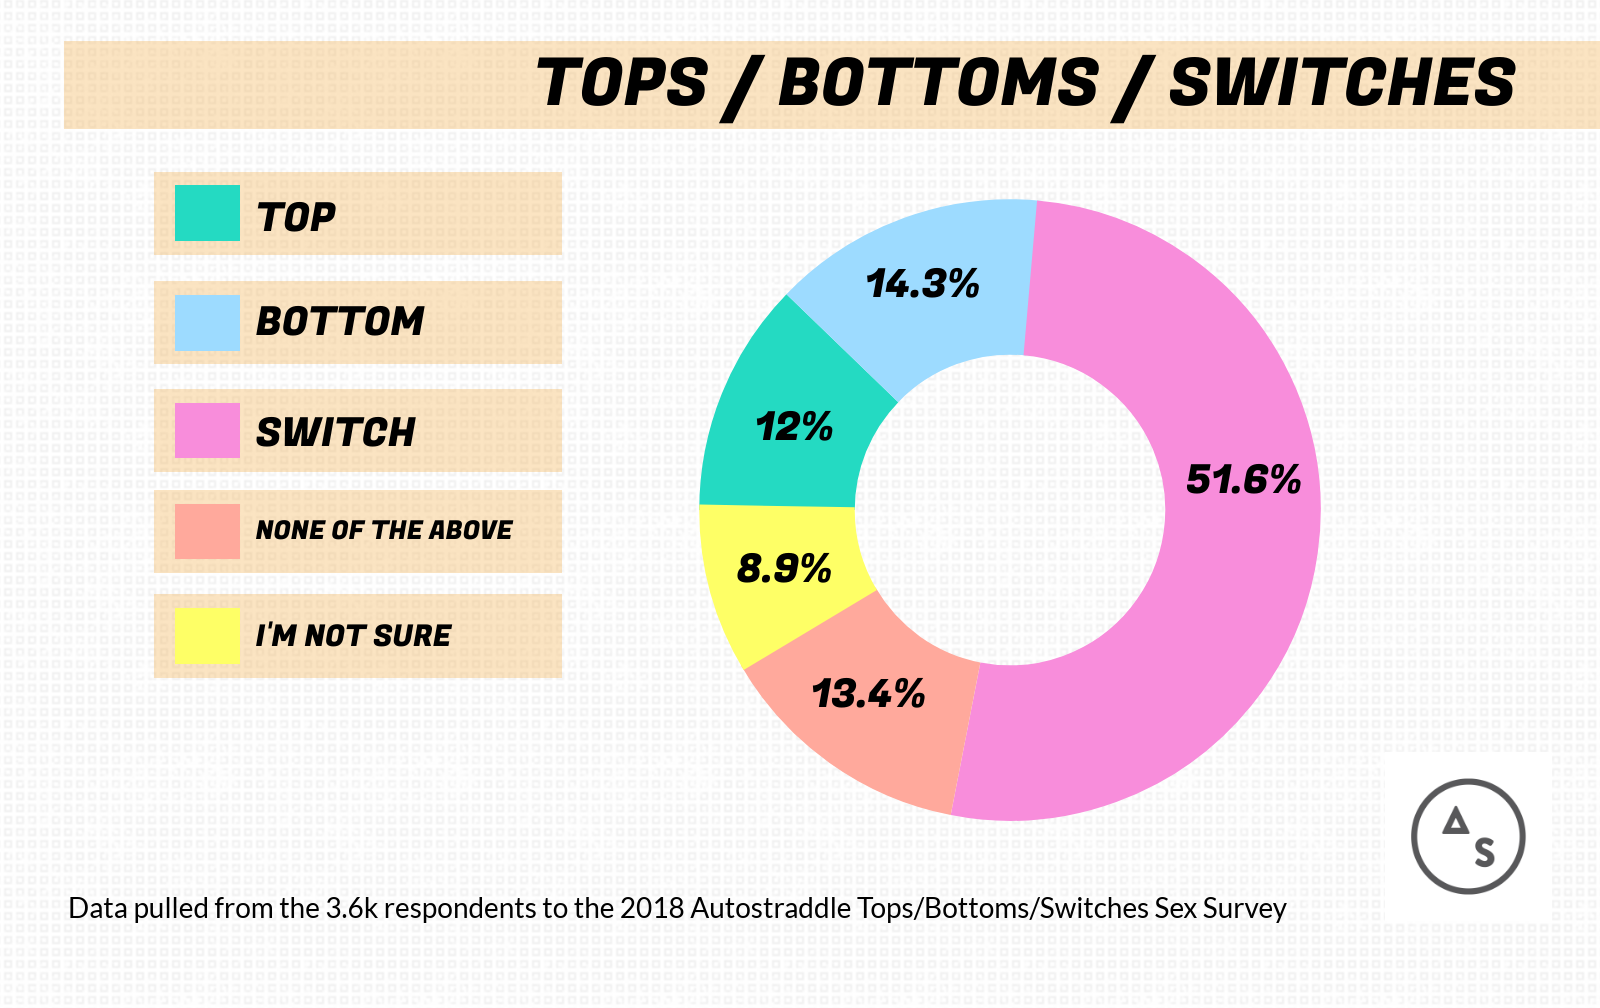
Tops: 12% // Bottom: 14.3% // Switch: 51.6% // None of the Above; 13.4% // I’m Not Sure: 8.9%
![]()
Looking at All The Data
Sex Acts
We’ve broken down popularity of various sex acts by sexual identity in previous posts. Here’s what the entire group is into:
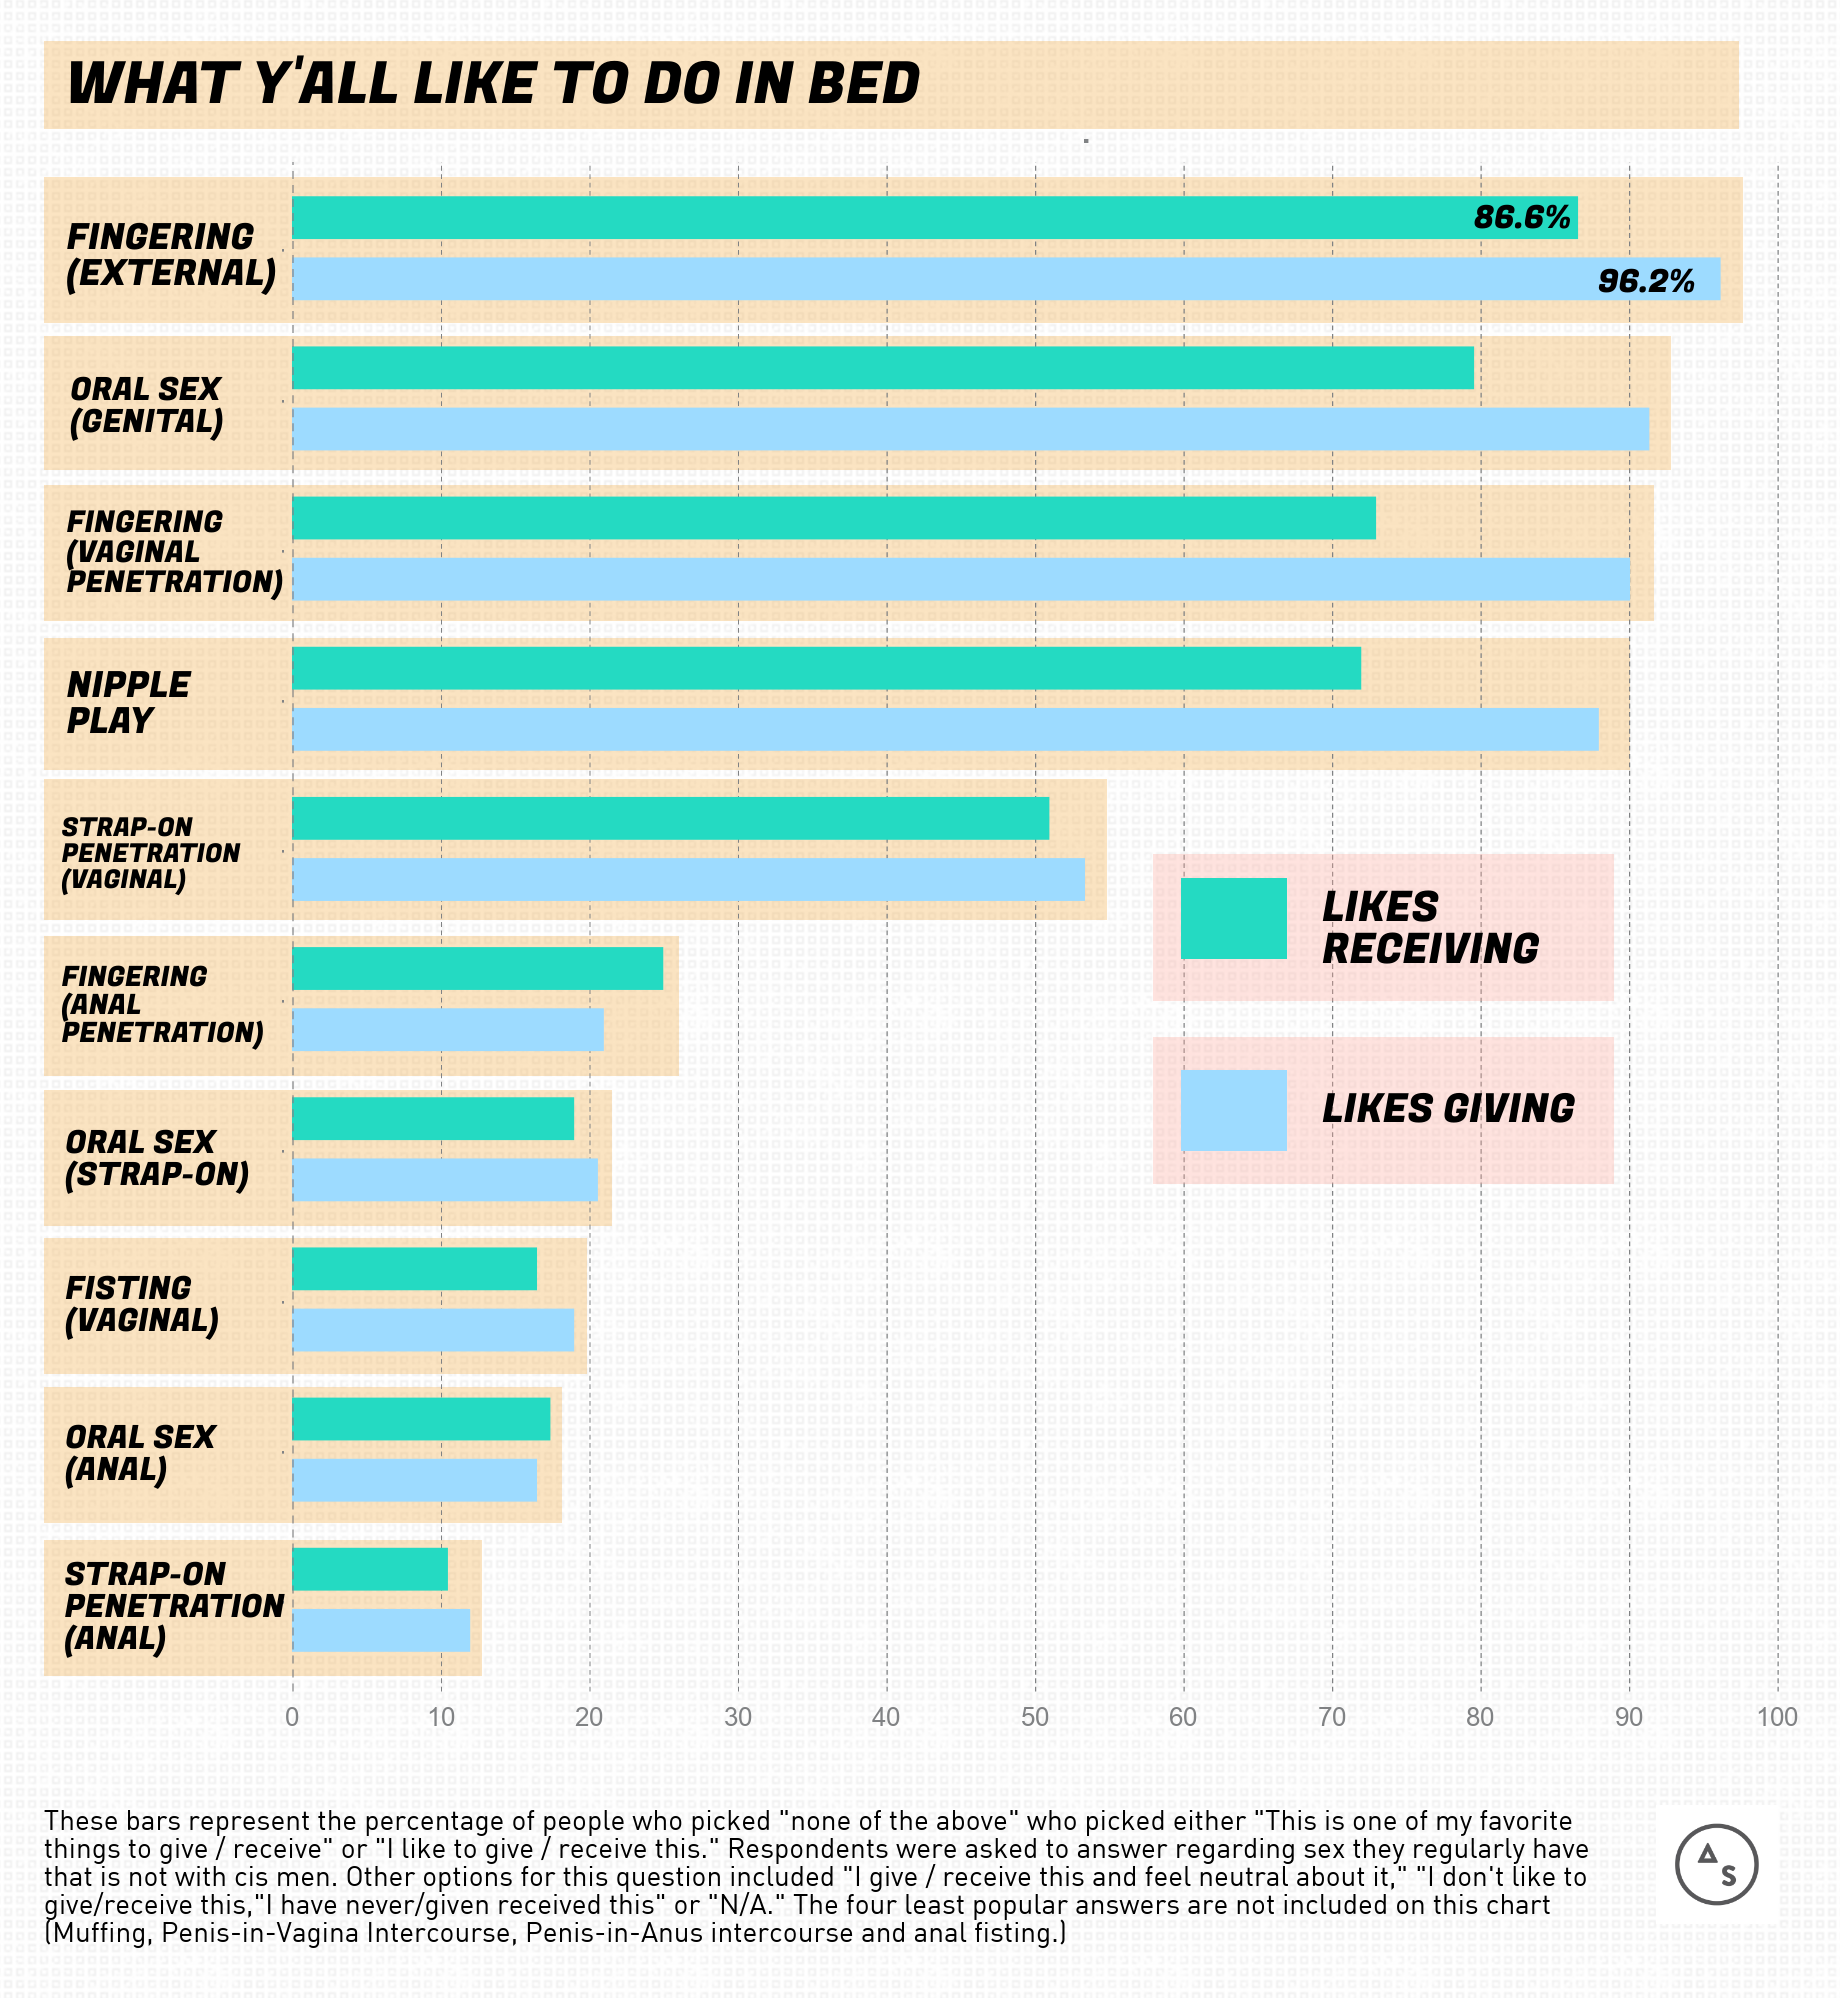
Notably, despite there being slightly more bottoms than tops in our group, y’all prefer to give things more than receive them pretty much across the board — unless it involves putting your mouth or finger in somebody’s asshole, at which point you’d rather have somebody do it to you than do it to somebody! Interesting.
Sexual Frequency
Survey-takers were asked “Within the past six months, how often have you, on average, had sex?” This is how that turned out:
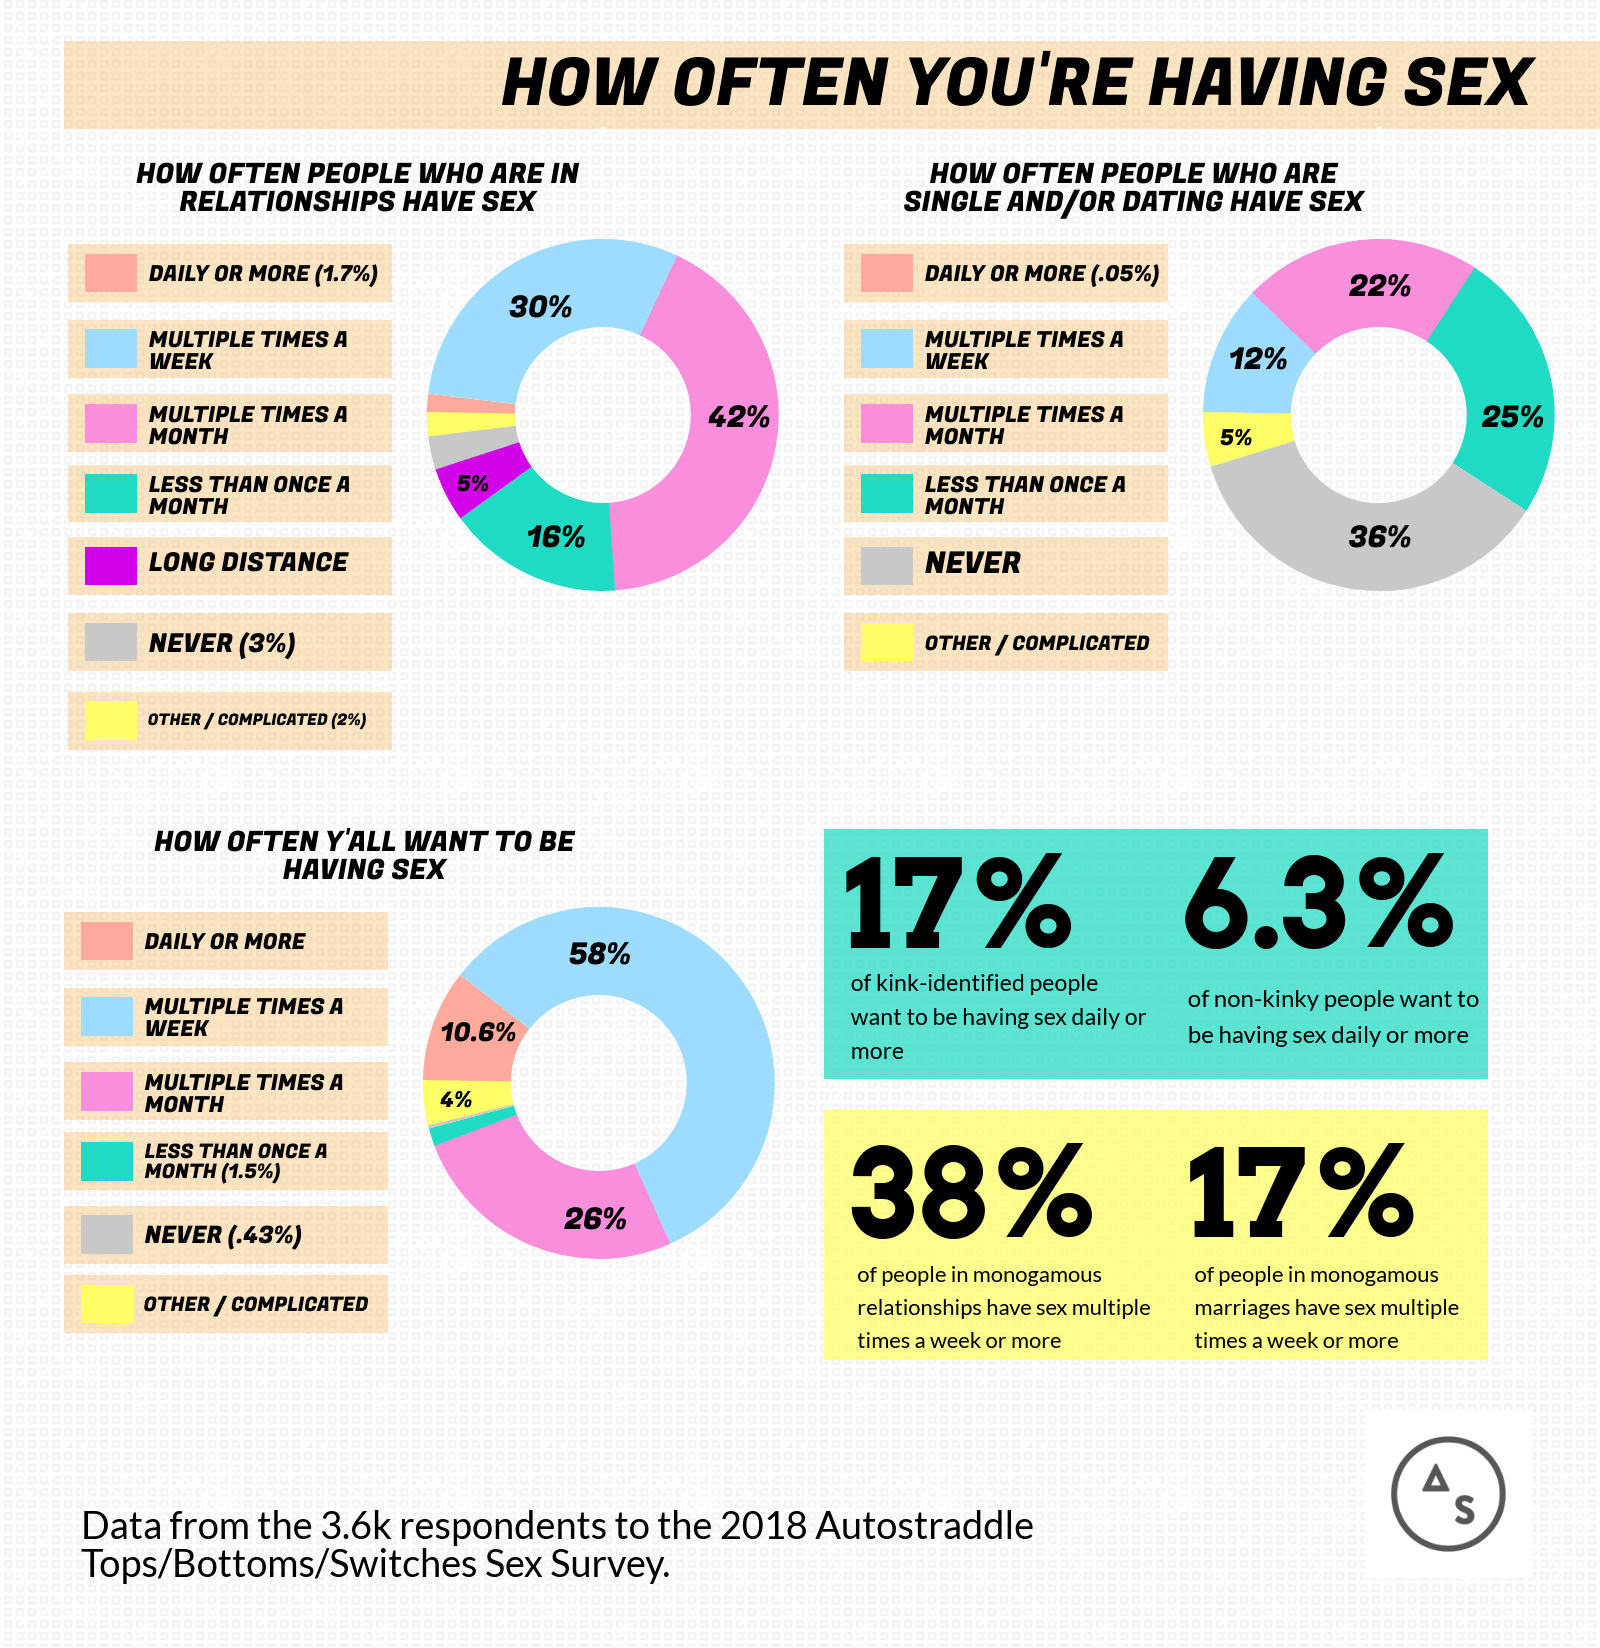
For the “Other/Complicated” option, survey-takers were required to describe their situation. I went through those and pulled all the ones that were about long-distance relationships and made that into its own category, and also pulled answers that did include a definite measure of sexual frequency and added those to their respective categories. Prior to doing so, around 10% of respondents picked Other/Complicated, usually because they felt simply picking one of the offered answers didn’t tell the whole story. Aside from long distance folks describing periods of daily sex alternating by periods of no sex, the most common situations mentioned here were people in uncharacteristic dry spells due to surgery, illness, depression or taking anti-depressants.
There wasn’t any significant correlation between top/bottom/switch identification and how often you have sex. In fact, aside from being in a relationship or not, not a whole lot impacted how often you reported having sex in a statistically significant way. Although most research shows opposite-sex couples have sex more often than same-sex female couples, the queers on our survey who were dating men were having sex at nearly identical rates as those dating women.
Also keeping even pace with each other? Those in monogamous and non-monogamous relationships, in line with the results of our 2015 Lesbian Sex Survey. We can’t really compare the two surveys because they were two separate self-selected samples, but it was interesting that the 2018 group seemed to be wanting and having way less sex overall than the 2015 group. Probably because of existential dread!
![]()
Sexual Experience and Positioning
Tops tended to have had more lifetime sexual partners than the other groups. 19% of tops have ridden the hobby horse with over ten women and 8% with over 20, compared to 9% and 3% for bottoms and 16% and 5% for switches.
Tops were also the least likely to have had sex with a man — 43% haven’t, compared to 37% of bottoms and 33% of switches.
![]()
Sexual Orientation
Here’s the basic breakdown of the group by sexual orientation:
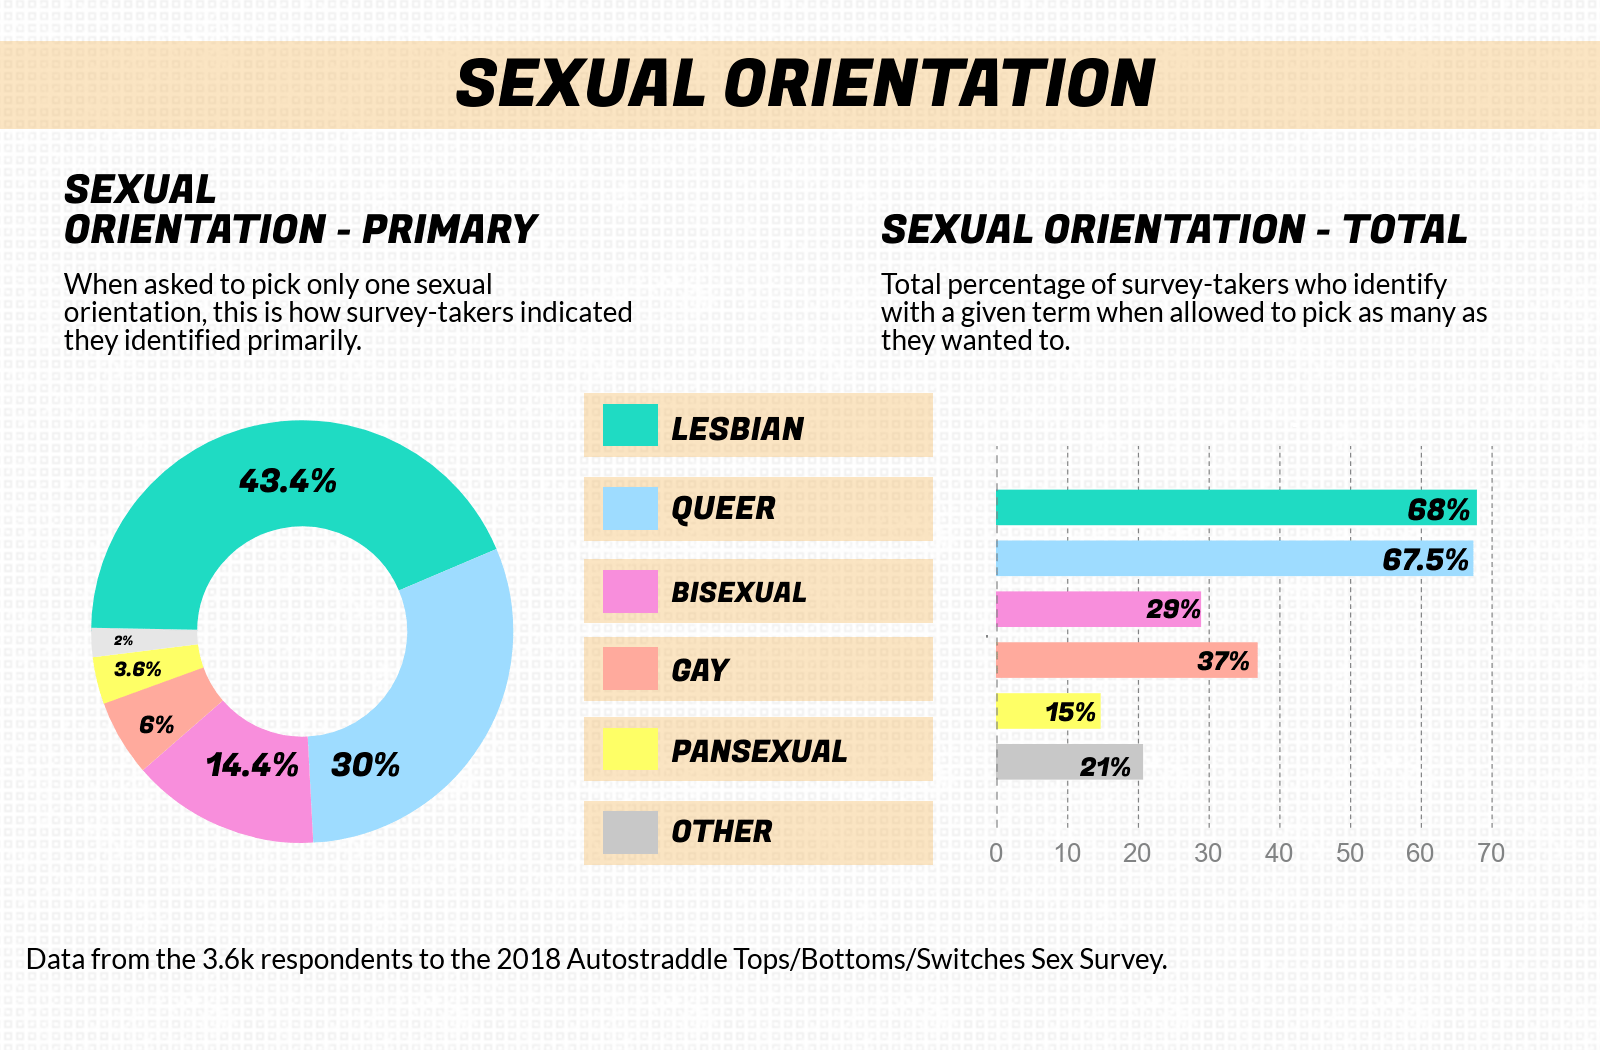
Some noted correlations:
- 65% of Pansexuals identify as switches, compared to 51% of the entire group and 50% of lesbians and bisexuals.
- 51.5% of tops identify as lesbians, compared to 44% of bottoms and 42% of switches.
- 19% of bisexuals identify as bottoms, compared to 14% of the entire group.
- 15% of lesbians and 18% of gay people identified as tops, compared to 8.6% of bisexuals, 7% of pansexuals, 11% of queers and 12% of the entire group.
![]()
Gender Identity and Presentation
Here’s how y’all feel about your gender today:
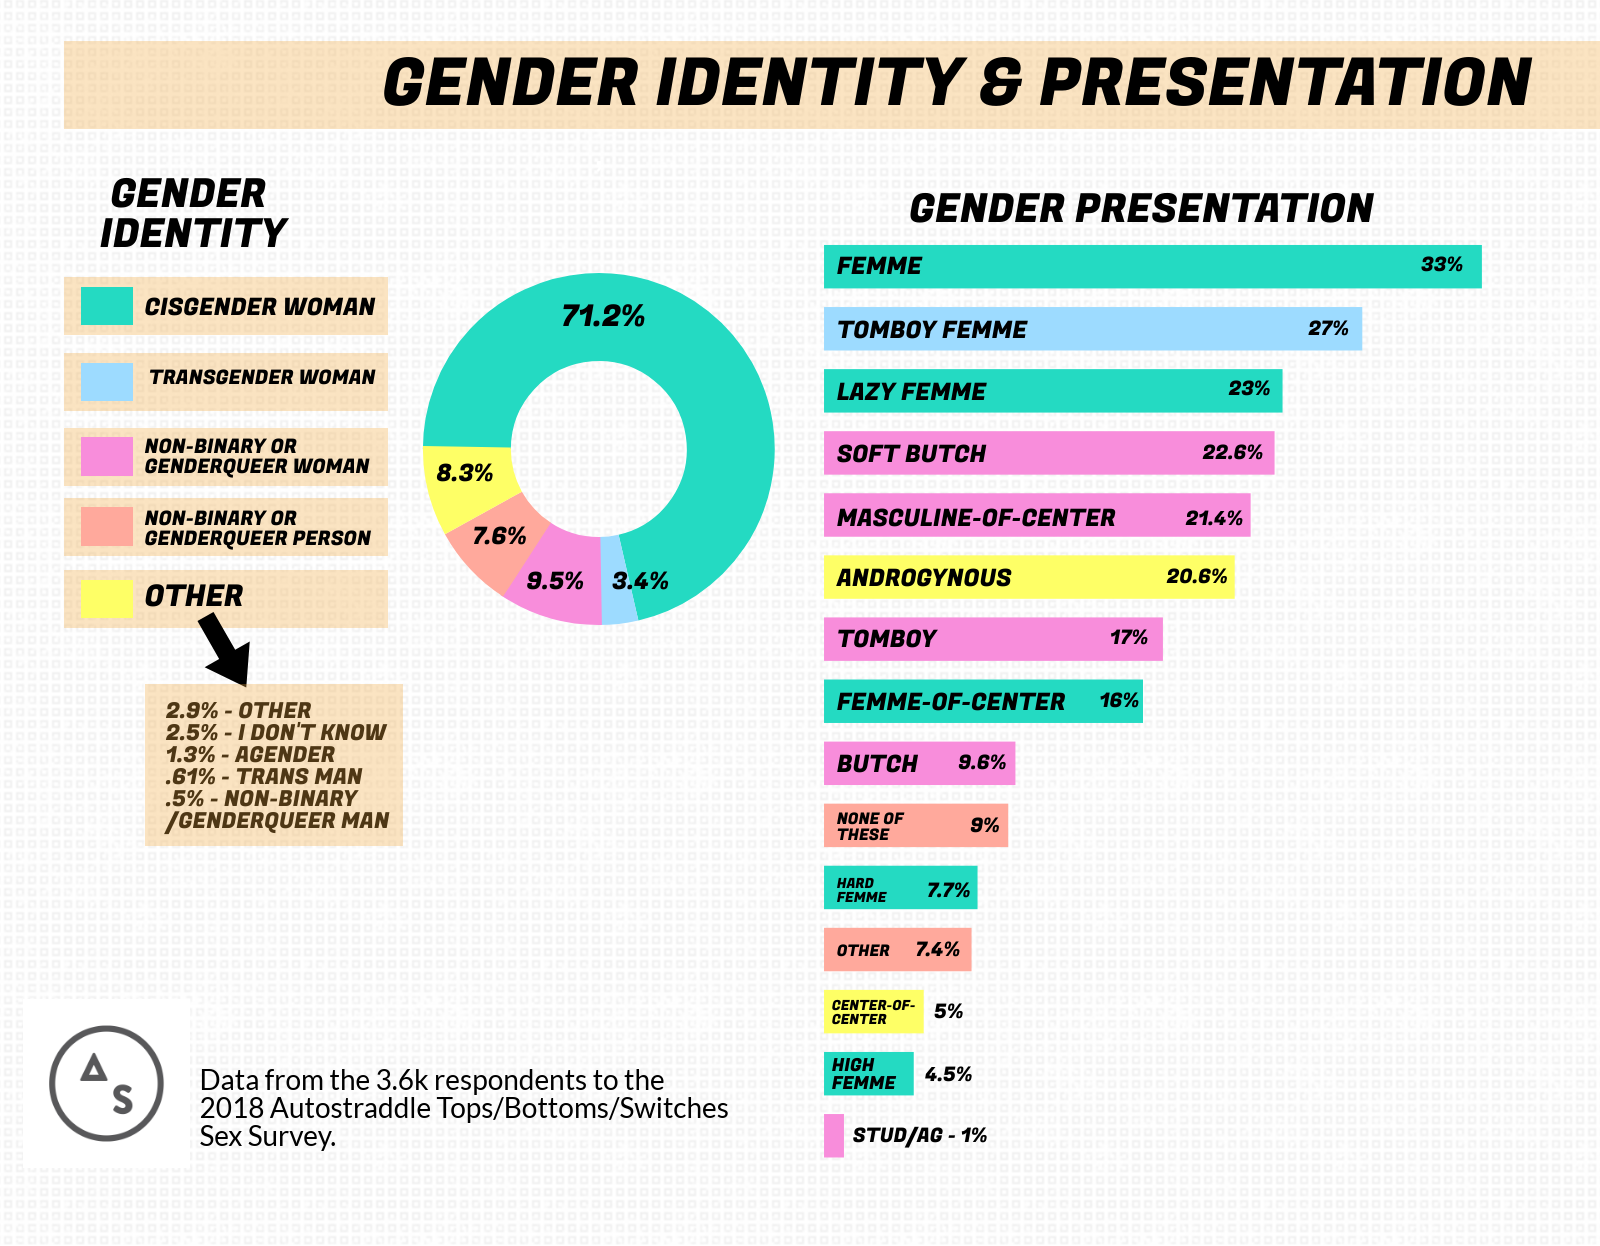
As discussed in our post on tops, our survey revealed that the “masculine partner = top” and “feminine partner = bottom” stereotype (which was, back in the day, an absolute directive) has a lot of truth to it, but it definitely can’t be applied across the board.
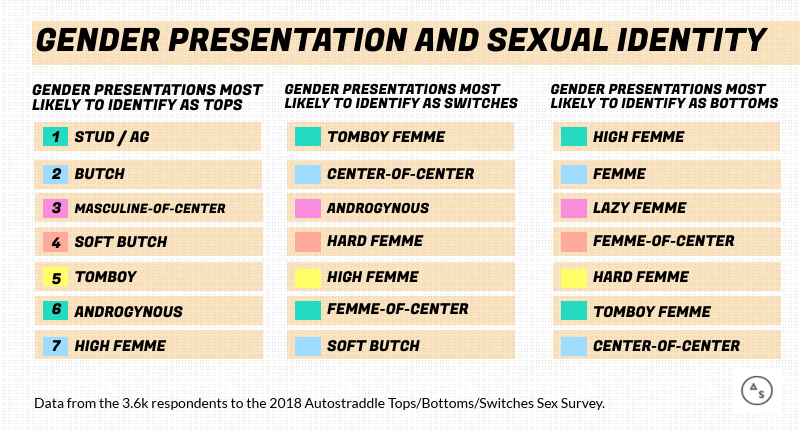
Around 8% of those who identified as high femme or hard femme identified as tops, compared to 12% of the entire group. Around 8% of soft butches and masculine-of-center folks identified as bottoms, compared to 14% of all survey-takers.
“Switch” was, of course, the most popular identity for all groups, with between 50 and 60 percent aligning themselves with switchiness — the only gender presentation with less than 50 percent being switch-aligned was butches, who just missed the mark at 49%. Tomboy femmes almost tipped the scale in the other direction but not quite — 59% are prone to switching it up. But, as discussed on the tops post, it’s never safe to assume what somebody’s into based on their gender presentation.
Many butches and femmes quoted in the tops post expressed frustration that they were assumed to be a top or bottom due to their gender presentation.
We also found some variances within gender identity and trans status too — like that trans women were the most likely to identify as bottoms. Non-binary/genderqueer men were most likely to identify as tops, but our sample size for that group (16) was too small to draw any significant conclusions.
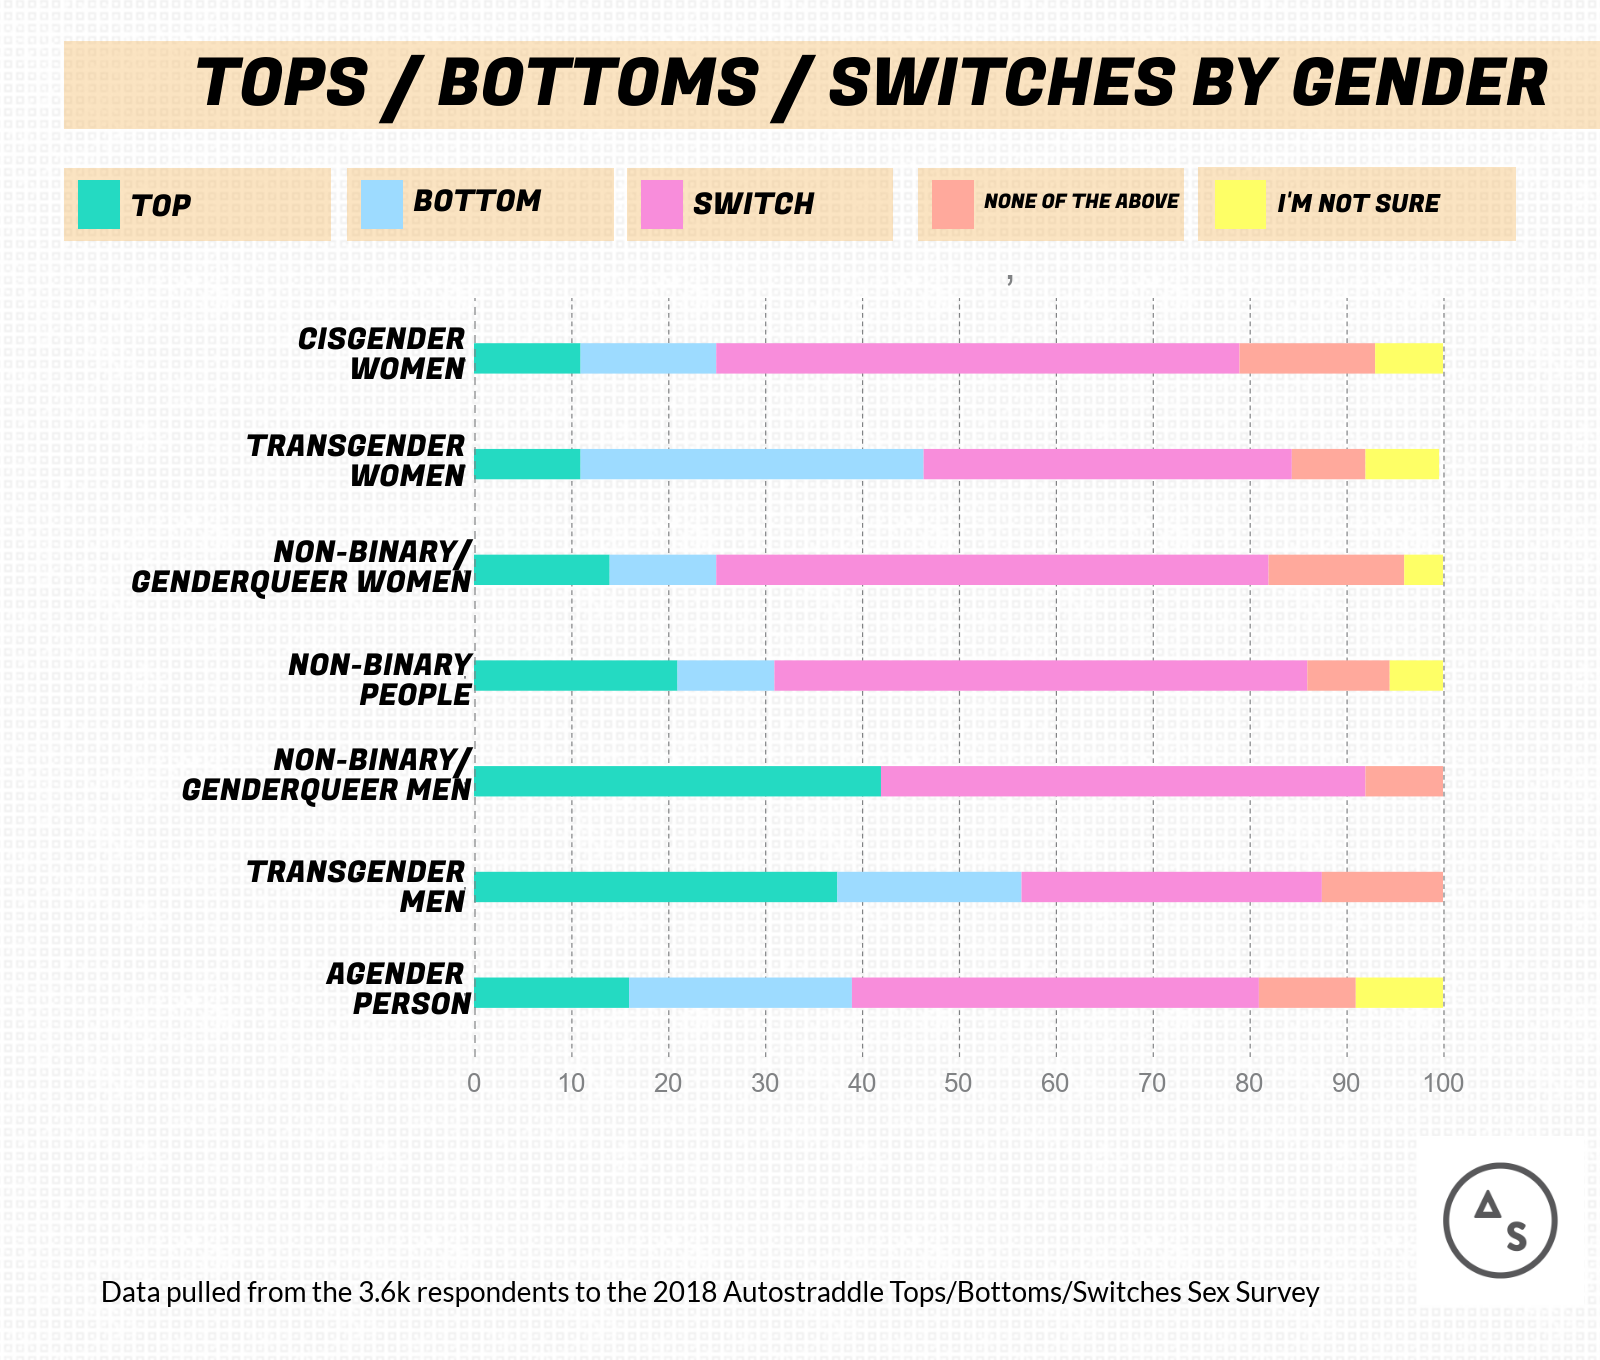
It also appears that non-binary/genderqueer women were most likely to identify as switches, and agender folks were most likely to “not be so sure.” Perhaps there is an overall correlation between being switches and identifying with terminology that some might consider oxymoronic, like “tomboy femme” and “non-binary woman.”
![]()
Geography – International
69% of survey respondents came from the U.S. and 31% were outside the U.S.. There were slightly more Europeans identifying as “none of the above” (17.6%, compared to 13% of people in the U.S. and 11% of Canadians). “I live in Europe, function in French (and Dutch), and for some reason “top”, “bottom” and “switch” here are mostly applied to sexual encounters between two male-identified people,” wrote one European, although to be fair, many Americans had the same impression.
“I don’t feel the need to apply categories,” wrote another. “I think its stressful and excludes possibility to experience without making a whole big deal out of it and panders to stockbuilding (as happens with categories of identity). But I am aware that it seems to be quite a thing in the US.”
We only had 109 survey-takers in Australia, but if that group is representative then I would like to offer a tip of the hat to the land down under and all my friends and family who reside there, you have evaded the alleged top shortage plaguing this nation with a remarkable 16.5% tops / 5.5% bottoms ratio.
Asia and Canada had similar numbers of people identifying with these terms as the U.S., and we didn’t have enough respondents in South America, Africa or Mexico to draw significant conclusions.
![]()
Geography – U.S.
83% of survey respondents lived in a city or major metro area and 17.25% in rural areas. We gave U.S. residents the option of indicating if they lived in nine specific cities/metro areas, or else they could say “I do not live in any of these cities or metro areas, but I do live in a city/major metro area” or “I do not live in a city or metro area.”
Lots of commenters chimed in to point out the nine cities we included were NOT the largest cities in this country or the most LGBT-populated cities. This is absolutely correct. In the interest of full disclosure: we have a writer doing a piece about one of those nine cities and therefore wanted to gather data about that city specifically, but it seemed weird to only ask about one city, so we threw in eight others more or less off the tops of our heads: New York, San Francisco/Bay Area, Los Angeles, Chicago, Atlanta, Boston, Minneapolis/St.Paul, Portland and Seattle.
Only 21 respondents were from Atlanta, a sample size too small for analysis. So we’re looking at those eight cities as well as other unlabeled city-dwellers (which I added Atlanta people to) and non-city folks. So you can arrange your grains of salt accordingly, here are the number of responses I had from each city: Portland, OR – 63, Los Angeles – 96, New York – 212, Chicago – 85, Seattle – 91, San Francisco/Bay Area – 124, Minneapolis/St.Paul – 53, Boston – 101.
This data turned out to be pretty fascinating and now I wish we’d asked about more cities! For the purposes of this analysis, I cut out the “I’m not sure” category, because SurveyMonkey said we didn’t have enough people picking that option for statistically significant results.
In order to compare city-specific data to the overall data, then, the overall numbers for the entire group with the “I’m Not Sure”s removed are: Top (14%), Bottom (15%), Switch (56.6%), None of the Above (14.5%)
- Highest percentage of tops: Los Angeles (22%), New York (17.4%), non-city/metro-areas (16.2%).
- Lowest percentage of tops: San Francisco/Bay Area (7%), Boston (9.7%), Portland (10.2%)
Regarding the tops in the non-city/metro areas, a “top shortage” theory we wrote down in my notebook was “ALL THE TOPS ARE IN THE WOODS / ON THE FARM?” But you know where else the tops are? On the 405 or trying to get a seat on the L train at the Bedford stop during rush hour.
- Highest percentage of bottoms: Minneapolis/St.Paul (24%), Boston (19%), Los Angeles (17.4%)
- Lowest percentage of bottoms: San Francisco/Bay Area (12.4%), New York (13.3%), Portland (13.6%)
It appears the bottoms are also on the 405 and quite a few are being helpful service-oriented neighbors to their fellow Midwesterners.
- Highest percentage of switches: Portland (66%), San Francisco/Bay Area (60%), Seattle (55.6%)
Portland is DTF, y’all, and happy to switch it up in order to meet your needs!
- Highest percentage of “None of the Above”: San Francisco/Bay Area (19.3%), Minneapolis/St.Paul (19.15%), Chicago (17%)
The people of San Francisco wanna blaze their own damn trails.
What about kink?
- Cities with the most kink-identified people: San Francisco/Bay Area (29.5%), Minneapolis (25.5%), Los Angeles (25.5%)
- Cities with the most people who are either kinky or down for kinky sex: Seattle (87%), Minneapolis (83%), Portland (80%)
![]()
If there’s anything specific you were curious about with regards to the data I collected or the open-answer questions we asked, let me know in the comments and if possible, I can address them in a future post!