AS Political Survey: What Top Political Issues Most Matter to Queer Communities During the 2020 Election?
As we head into the 2020 election, our contributing data brain, Himani Gupta, is analyzing data from past Autostraddle surveys to find out what issues are most important to our community and what is currently at stake.
Have you ever wondered what America would look like if the reins were handed over to queer people who are women, non-binary and/or trans?
Wonder no more! Using data from Autostraddle’s first-ever political survey, I present to you the gay agenda, as told to me, by you. In this post, we’ll look at the top priority issues in our community, including: LGBTQ+ rights, climate change, income inequality and more!
Who Took the Politics Survey
Before revealing the gay agenda, let’s take a quick look at who took the Politics Survey.
The Politics Survey could be accessed by anyone online through a post on Autostraddle’s website. The survey was open December 3, 2019 through January 10, 2020. Our analysis sample consists of 2,384 queer people who are women, non-binary and/or trans.
In July, I reached out to 994 Politics Survey respondents who said they were comfortable with being contacted about their responses. 662 people completed a Follow Up Survey between July 26 and August 16.
The figure below shows demographic characteristics of Politics Survey and Follow Up Survey respondents, along with comparison data on the U.S. population.

For more information on who took the surveys, see the “Who Took the Survey” portion of the post on health care.
Before the Pandemic, Our Community Had a Fundamentally Different Set of Priorities than the U.S. Population
The Politics Survey presented respondents with a series of issues and asked them to indicate whether each one was a “top priority” for the U.S. President and Congress, “important but lower priority,” “not too important,” “not a priority” or “should not be done.” This set of questions was taken from the Pew Research Center’s annual political survey of U.S. adults.
The figure below compares the percentage of Politics Survey respondents who selected each issue as a top priority to the results from Pew’s January 2020 survey. Two things stand out immediately. First, our community has a fundamentally different set of priorities than the U.S. population overall. Second, our community has a broad consensus on what the most important issues are and are not.
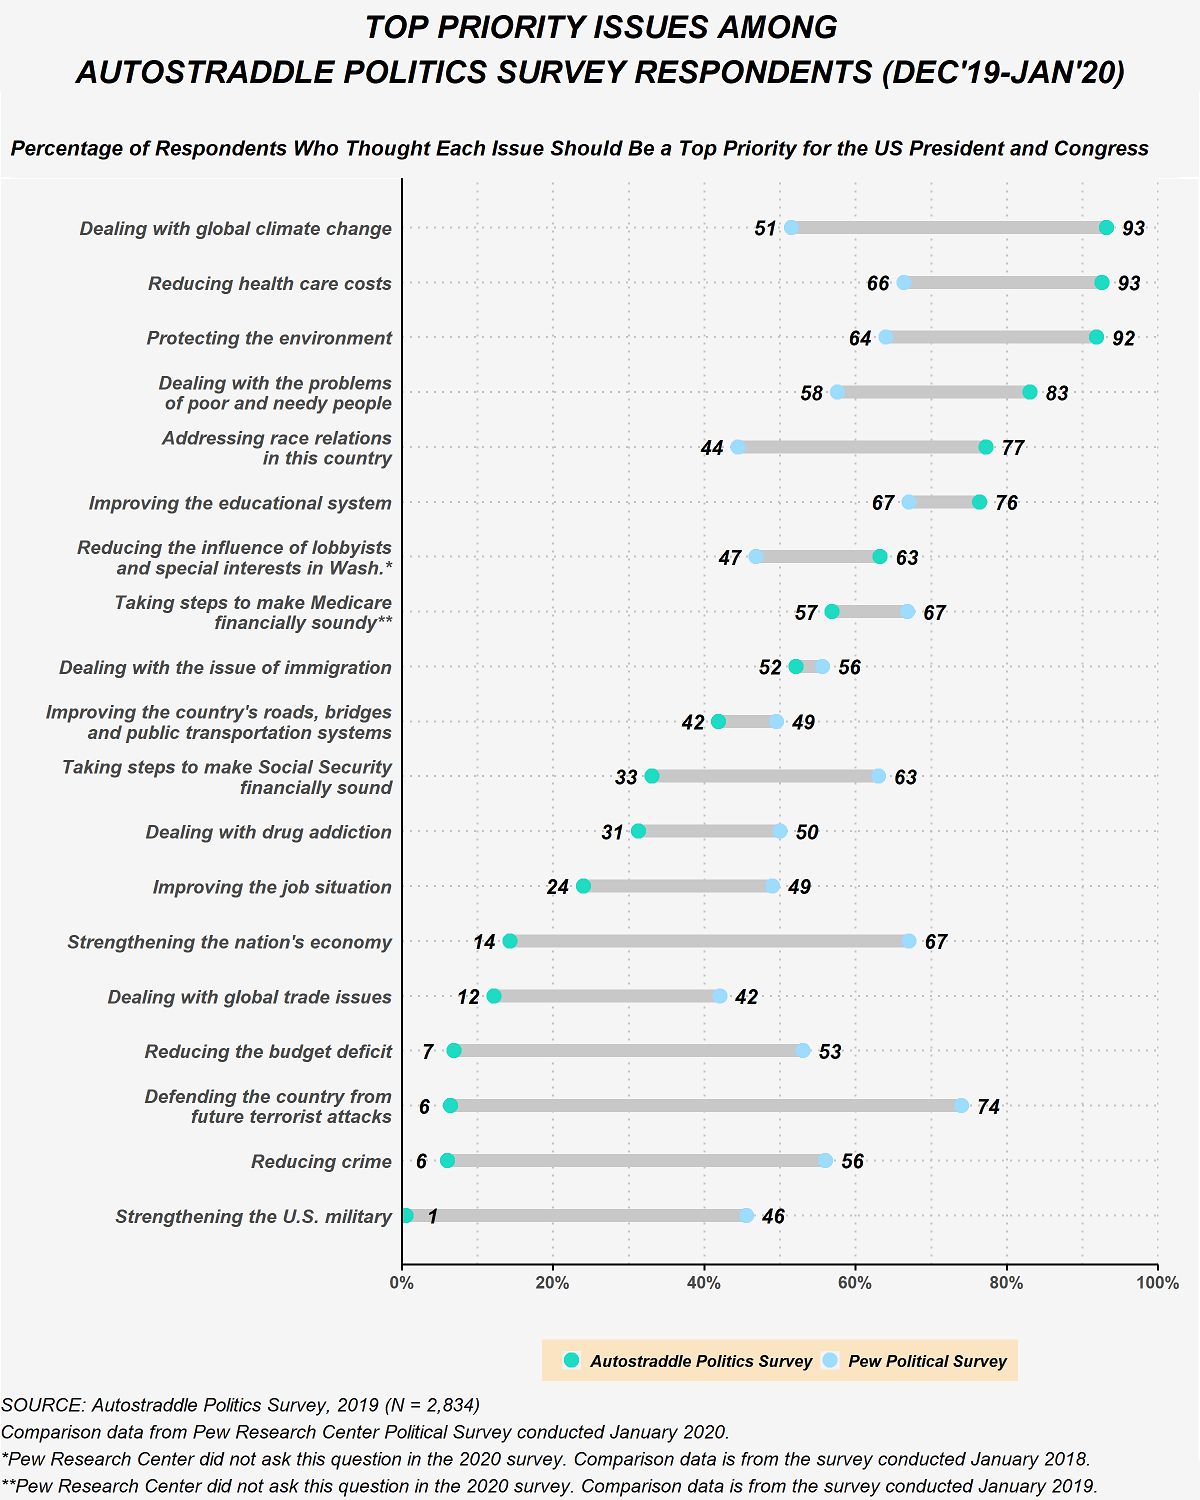
One of the several limitations of using survey questions intended for the U.S. population generally is that they overlook some key issues. A glaring omission in the Pew Research Center’s question about top priorities is, of course, LGBTQ+ rights. We also asked respondents to list other top priority issues. Reproductive rights, voter suppression, criminal justice reform, income inequality, gun control and the housing crisis recurred in the responses.
The Autostraddle Politics Survey dove into several of these topics to get a better view of respondents’ perspectives. We’ve previously covered reproductive rights, health care and criminal justice reform in greater detail.
LGBTQ+ Issues: “It’s Hard to Not Pick Them All as Top Priority”
There aren’t a whole lot of surveys focused on LGBTQ+ issues from the perspective of LGBTQ+ people, so for this part of the Politics Survey, we developed our own questions (drawing from a survey by Out.com/YouGov last November and the Pew Research Center in 2013). Once again, we listed several issues and asked respondents to tell us which ones were priorities (using the same categories from earlier). The figure below shows these results.
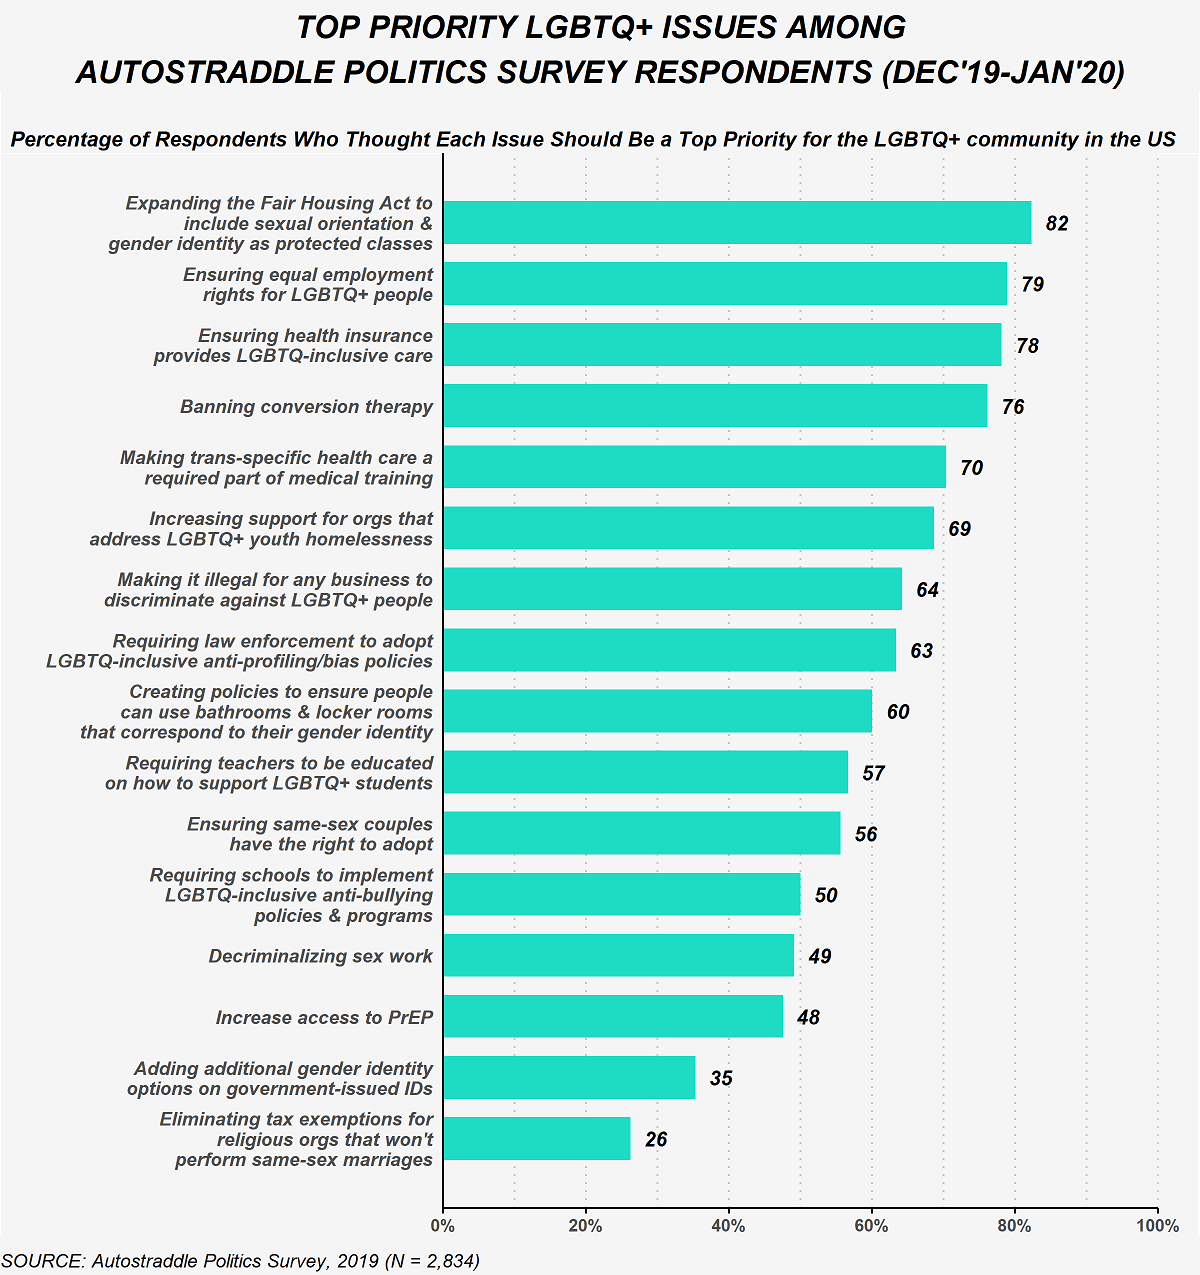
So many of these issues were important to the majority of our respondents. But breaking these results down by demographic characteristics reveals some important differences.
By and large, more trans women and non-binary respondents rated LGBTQ+ issues as “top priorities” as compared to cis women respondents. A higher proportion of trans women and non-binary respondents consistently selected issues that disproportionately affect trans and non-binary people as “top priority” compared with cis women respondents. This includes insurance coverage for LGBTQ-inclusive care, increasing support for organizations dedicated to LGBTQ+ youth homelessness and increasing access to PrEP.
The differences were especially striking for bathroom access (top priority for about 75% of trans women respondents, about 65% of non-binary respondents and about 55% of cis women respondents) and decriminalizing sex work (top priority for nearly 70% of trans women respondents, about 60% of non-binary respondents and about 40% of cis women respondents).
On expanding gender options on government ids, trans women and non-binary respondents differed: about 45% of trans women respondents said it was a top priority compared with a third of non-binary people and cis women respondents. In the comments, several expressed that they’d rather see gender identity removed from ids altogether.
Differences by age were also prominent. Respondents aged 45 or older were generally less likely than younger respondents to select these LGBTQ+ issues as top priorities. Some of the policy-specific differences correspond to what we’ve previously discussed with criminal justice reform, where older respondents were a little more ambivalent about progressive criminal justice reforms. For instance, only a quarter of respondents aged 45 or older said decriminalizing sex work was a top priority issue compared with half of respondents under 45. Also, respondents aged 45 or older were much less likely to select health care related issues (insurance coverage, trans-inclusive medical training and access to PrEP) as top priorities.
There were few, generally modest differences when comparing LGBTQ+ priorities by sexual orientation, race, disability status, income and where respondents live.
Of course, this list of issues is also not comprehensive. In comments respondents indicated other LGBTQ-specific concerns they had. These included expanding refugee and asylum status for LGBTQ+ people, making gender identity and sexual orientation protected classes in civil rights law broadly, reversing the trans military ban and making health care inclusive of intersex people.
Climate Change: “We are Frogs Sitting in an Ever Hotter Pot of Water.”
Over 90% of Politics Survey respondents selected climate change and “protecting the environment” as top priority issues. In a later question, 99% of Politics Survey respondents said the U.S. needs to do more to address climate change compared to 67% of registered voters (from an August 2019 Quinnipiac poll). Politics Survey respondents saw the situation with extreme urgency. Again and again, in the comments, respondents expressed devastation (variations on “We’re all going to die” showed up repeatedly) and the existential need for immediate, meaningful action. For so many respondents, this was the single most important issue, far above any of the others.
In terms of what to do, 94% of Politics Survey respondents said a Green New Deal that “[invests] government money in green jobs and energy efficient infrastructure” was a “good idea.” This level of support is the same as the 93% of U.S. adults who identify as progressives, but much higher than 63% of adults overall (from a July 2019 NPR/PBS NewsHour/Marist Poll). In the comments, several respondents said the Green New Deal is just a starting point and that much, much more needs to be done. As one person observed (and others similarly reflected), “The real answer is ending capitalism.”
The Economy: “It’s a Lie.”
In stark contrast with the U.S. population overall, Politics Survey respondents largely deprioritized traditional economic concerns, with a third or less of respondents selecting any of the following as a top priority issue: “improving the job situation,” “strengthening the nation’s economy,” “dealing with global trade”, “reducing the budget deficit” and making Social Security “financially sound.”
Respondents living with disabilities and those aged 45 or older were 10 and 20 percentage points (respectively) more likely to say that making Social Security “financially sound” was a top priority, probably because more of these respondents utilize or know someone who utilizes Social Security. However, in both cases the communities were divided on this issue with less than 50% of respondents living with disabilities and respondents aged 45 or older choosing that as a top priority issue.
Around 80% of all Politics Survey respondents felt that “dealing with the problems of poor and needy people” was the top priority economic issue. As mentioned earlier, many respondents listed income inequality as another top priority issue; several others mentioned equal pay, student loan debt and labor rights.
90% of Politics Survey respondents wanted to see a $15 national minimum wage, compared to 56% of U.S. adults overall and 86% of progressives (from a July 2019 NPR/PBS NewsHour/Marist Poll). Many respondents commented that the minimum wage should be even higher. Several noted that it should be tied to cost of living to account for current variations across the country and to control for future price increases. Others would rather see universal basic income instead.
Relatedly, 94% of Politics Survey respondents felt that the federal government needed to do more to ensure equal pay between men and women in the private sector, while registered voters in the U.S. were much more ambivalent (from a September 2019 Politico/Morning Consult poll). In the comments, several respondents also raised the need to address income disparities by race.
On student loans, 93% of Politics Survey respondents supported forgiving up to $50,000 for people with household incomes below $250,000, compared to 57% of registered voters (from an April 2019 Quinnipiac poll). Even accounting for our younger, more credentialed (and therefore more debt-laden) sample, Politics Survey respondents were still far more in favor of loan forgiveness and many commented that all loans should be forgiven.
Race Relations: “He Just Lifted the Mask.”
“Addressing race relations” was a top priority issue for a much larger proportion of Politics Survey respondents than U.S. adults. In a follow up question, 98% of Politics Survey respondents said they thought “white supremacist groups pose a threat in the U.S.” compared to 65% of registered voters (from a March 2019 Quinnipiac poll).
90% of Politics Survey respondents felt that the “level of hatred and prejudice in the U.S. has increased” under Trump and 8% said it hadn’t changed, compared to 64% of U.S. adults saying “increased” and 28% saying “hasn’t changed.” In comments, several Politics Survey respondents elaborated that the visibility and violence of hate and prejudice have increased under Trump, though the underlying beliefs haven’t necessarily changed.
In terms of prejudice against different racial groups, sweeping majorities of Politics Survey respondents viewed prejudice against Black people, Latinx people and Indigenous people as “very serious problems:” 93% when asked about Black people, 88% when asked about Latinx people and 84% when asked about Indigenous people. In contrast, just under 45% of registered voters said prejudice against Black and Latinx people was a “very serious problem” (from an August 2019 Quinnipiac, which did not ask about Indigenous people). And on the other end, more U.S. adults selected “reducing crime” as a top priority rather than “addressing race relations,” even though we all know that policies around so-called crime reduction only serve to exacerbate racial issues in this country. In contrast, just 6 percent of our Politics Survey respondents viewed “reducing crime” as a top priority issue. Instead, in the comments respondents raised substantial overhaul of the criminal justice system (police and prison abolition) as a top priority.
Immigration: “Climate Change Doesn’t Recognize National Borders”
52% of Politics Survey respondents selected “dealing with the issue of immigration” as a top priority, but many commented that they didn’t know how to answer that question since the way in which the issue was dealt with would dramatically change their answer (ie, “open borders” versus “build the wall”).
96% of Politics Survey respondents supported a pathway to citizenship which is the same as the 95% of progressives who support it though far higher than the 64% of U.S. adults nationally (from a July 2019 NPR/PBS NewsHour/Marist Poll). However, 83% of Politics Survey respondents supported decriminalizing crossing the U.S. border without authorization compared to only 54% of progressives and 27% of U.S. adults overall. 89% of Politics Survey respondents also wanted to see asylum laws “loosened to accept more claims” compared to just 25% of U.S. adults (from a September 2019 Harvard/Harris poll).
Politics Survey respondents commented on the hypocrisy of harsh immigration restrictions given that the U.S. was founded on stolen land. Many mentioned the extraordinary cruelty at the hands of the Trump administration: the detention of children and family separations. Several wanted to see ICE abolished. Others observed that the legal pathways to immigration and citizenship were incredibly complicated and impossible to navigate.
Another theme that emerged in the comments was the lack of responsibility on the part of America. Many people trying to enter the U.S. are fleeing conflicts of American making in Latin America and the Middle East. Asylum, which already had an absurdly low cap during the Obama years, has been practically non-existent under Trump. Instead, Politics Survey respondents wanted to see fully open borders, especially since climate change (also largely of America’s making) is creating yet one more refugee crisis.
U.S. Military: “They Need to be So Majorly Defunded”
Politics Survey respondents largely thought that “defending the country from future terrorist attacks” was not a top priority; over 50% of respondents indicated that this was “not too important” or “not a priority.” When it came to “strengthening the U.S. military” over 50% of respondents flat out rejected that proposition and said it “should not be done.”
Many respondents commented that military spending should be reduced and reallocated to public services in the U.S. or the State Department. Generally, those who left comments opposed war and wanted the U.S. to end its long, imperialist entanglements in Latin America and the Middle East. Several observed that Trump made an already-bad situation decidedly worse with his ignorance, erratic behavior and pandering to dictators.
At the same time, some commenters acknowledged that extricating the military isn’t straightforward, either. For instance, many referenced Trump’s abandoning the Kurds in Syria, as an instance where, while they generally opposed U.S. military involvement, they also opposed suddenly withdrawing troops without diplomatic solutions in place.
Gun Control: “I Carry a Bleed Kit Because Shootings are So Common.”
Gun policy wasn’t on the list of issues on the Pew Research Center’s 2018 political survey, which I used as the basis for the Politics Survey. (It was on Pew’s 2020 political survey and 46% of U.S. adults viewed it as a top priority issue.) The Politics Survey did include a few questions on gun policy, however.
97% of Politics Survey respondents supported the House bill closing the private seller loophole on background checks. Background checks have broad support in the U.S. with 83% of registered voters in favor (from a September 2019 Quinnipiac poll). Among our Politics Survey respondents, there was also strong support for an assault weapon ban and mandatory buyback with 89% supporting. U.S. adults are divided on this issue, with only 43% supporting (from an August 2019 Monmouth poll).
There was a notable difference within our community on gun policy by gender identity. Cis women, non-binary people and non-binary women respondents were in favor of the gun control policies mentioned at roughly the rates noted above. The majority of trans women respondents also supported the policies mentioned but not by the same margins. On mandatory buybacks, specifically, 72% of trans women respondents supported the policy while 15% opposed and 14% were uncertain. In the comments, a few trans women respondents explained that a foreseeable consequence of the mandatory buyback is greater police presence in low income, predominantly Black communities, a position also held by progressive Democratic presidential primary candidate, Julián Castro.
Many, many respondents (across all genders) wanted all guns banned. Over 80% were worried about a mass shooting in their communities. So many described being traumatized by gun violence and mass shootings that had already happened in their communities and living under the constant threat of gun violence. Several respondents wanted to see bans for domestic abusers and law enforcement disarmed, as well. But another theme that emerged among a minority of respondents was that — in the absence of disarming the police, military and white supremacists — oppressed, marginalized communities should arm themselves in self-defense.
And Then There Was a Pandemic
So much has happened since the Politics Survey was fielded, so we followed up with some of the original Politics Survey respondents to see how their views have shifted. Instead of repeating the questions on top priority issues from Pew, we used a series of questions asking whether different issues in the U.S. are “a very big problem,” “a moderately big problem,” “a small problem” or “not a problem at all.” (You might think Trump himself wrote the answer options for this question, but it was, in fact, taken from Pew’s American Trend Panel.)
The results are shown below. As we saw in the Politics Survey, Follow Up Survey respondents have drastically different concerns than U.S. adults generally, and they also broadly agree on what problems are the biggest and not the biggest.
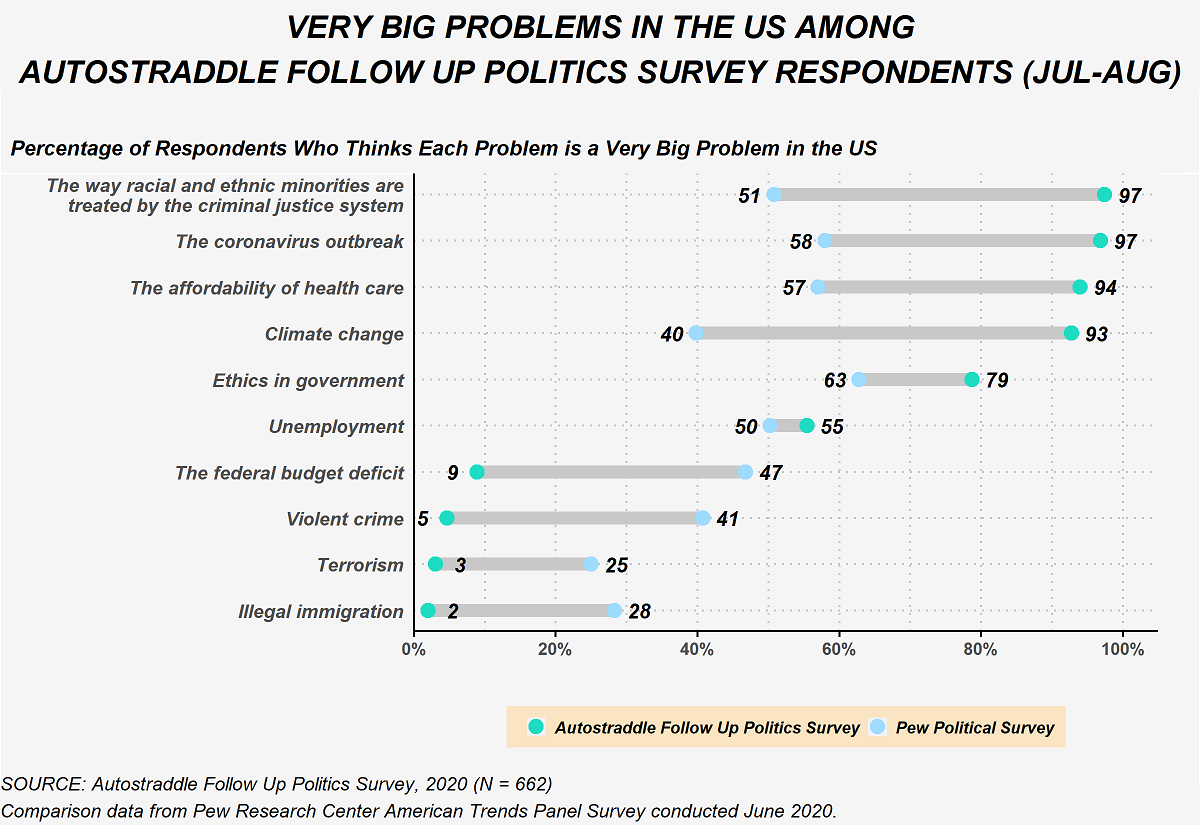
The pandemic and the treatment of racial minorities (people of color) in the criminal justice system were considered “very big problems” by nearly everyone who took the Follow Up survey. Climate change and health care affordability were viewed by Follow Up Survey respondents as “very big problems” at the same rates as these issues were top priorities on the Politics Survey. On the other end, terrorism, violent crime and the budget deficit were considered “very big problems” by roughly as few respondents as who thought these issues were “top priorities” on the Politics Survey. Several respondents commented that they thought domestic terrorism and state-sanctioned violence were very big problems but knew that this is probably not how the question was intended.
Once immigration was clarified by the use of the word “illegal,” Follow Up Survey respondents unequivocally rejected it with two-thirds declaring it to be “not a problem at all.” Unemployment came to the forefront for over half of Follow Up Survey respondents, more than doubling the quarter of respondents who viewed the related issue of “improving the job situation” as a “top priority” on the original Politics Survey. While the questions are asking slightly different things, this drastic increase is likely in response to the rampant unemployment in the wake of the pandemic.
When asked to identify other big problems, many of the same topics came up as in the Politics Survey free responses. Right-wing extremism and fascism were new additions that occurred with some frequency.
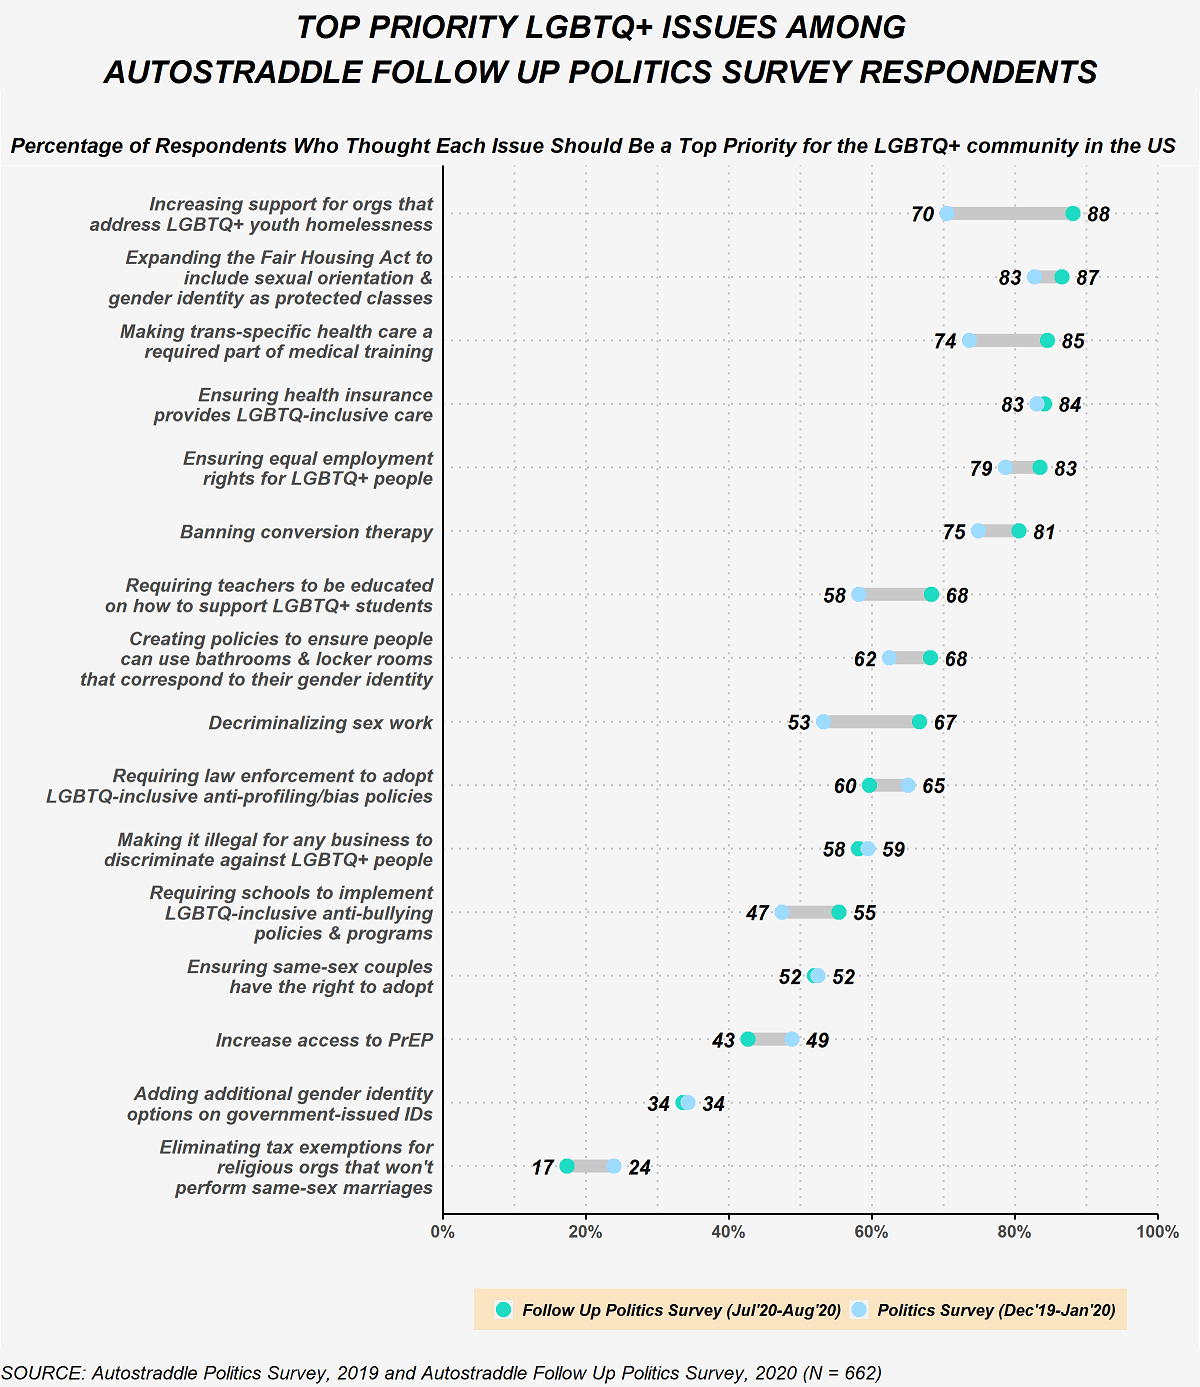
LGBTQ+ Priority Issues Shift towards Trans Rights and Supporting Youth
In the Follow Up survey we asked respondents to identify their top priorities among the same LGBTQ+ issues from the Politics Survey. These results are shown in the figure below. There were meaningful shifts towards prioritizing issues affecting trans people and LGBTQ+ youth and decriminalizing sex work. Interestingly, despite the Supreme Court ruling on LGBTQ+ employment protections in Bostock earlier this summer, ensuring equal employment rights remained a top priority issue for over 80% of Follow Up survey respondents.
So there we have it. If queer people who are women, non-binary and/or trans were running the country it would be, undeniably, a more environmentally friendly, equitable and humane place to live. And while the U.S. is a long way from achieving the things so many of us care about, this election — like every one that came before it and every one that comes after — brings us one step closer towards realizing the policies we want. The work doesn’t stop with voting (by any means), but it’s a critical part of our political action toolkit. And after the election, we need to keep applying pressure on our newly-elected officials to make our priorities their priorities.
AS Politics Survey: LGBTQ Health Care & Amy Coney Barrett’s Impacts
As we head into the 2020 election, our contributing data brain, Himani Gupta, is analyzing data from past Autostraddle surveys to find out what issues are most important to our community and what is currently at stake.
In this week’s Senate confirmation hearings, Amy Coney Barrett’s reticence to talk about her positions made it pretty clear how much damage she plans to do once she gets to the Supreme Court. Among the many disturbing things we know about Barrett’s political views, her stances on several health care issues are going to inflict a lot of harm on a lot of people.
Autostraddle’s Politics Survey, launched in December 2019, asked about a number of topics related to health care, namely: religious freedoms, reproductive rights and the affordability of care. At the end of July, I followed up with some of the original survey respondents to see if anything changed in terms of how they thought about the affordability issues in the wake of the pandemic.
We’re going to look at just how important these issues are to our community and discuss what’s at stake with Barrett’s impending nomination to the Supreme Court.
Who Took the Politics Survey
Before we turn to those results, we need to start by understanding who took the Politics Survey and who participated in the follow up.
The Politics Survey was available for anyone to take on Autostraddle’s website between December 3, 2019 and January 10, 2020. Over 4,400 people started the survey and just over two thirds made it to the mandatory questions on gender identity and sexual orientation. The analysis is restricted to queer people who identified as women, non-binary and/or trans, which gives us our sample of 2,834 respondents.
At the end of July, I reached out to the 994 Politics Survey respondents who said they were open to being contacted for follow up. Between July 26 and August 16, 662 people completed the Follow Up Survey. This divides our original sample into two subsamples: people who took the Follow Up Survey and people who didn’t.
For the most part, the Follow Up Survey respondents are a similarly diverse group of people compared to those who didn’t take the Follow Up Survey. A slightly greater proportion of trans women and non-binary women took the Follow Up Survey. The gender identities and sexual orientations of respondents to both surveys are shown below.

While the two subsamples are similar in terms of race/ethnicity, disability status and age, they differ on education. As shown in the figure below, more of the Follow Up Survey respondents earned a bachelor’s degree as their highest degree.
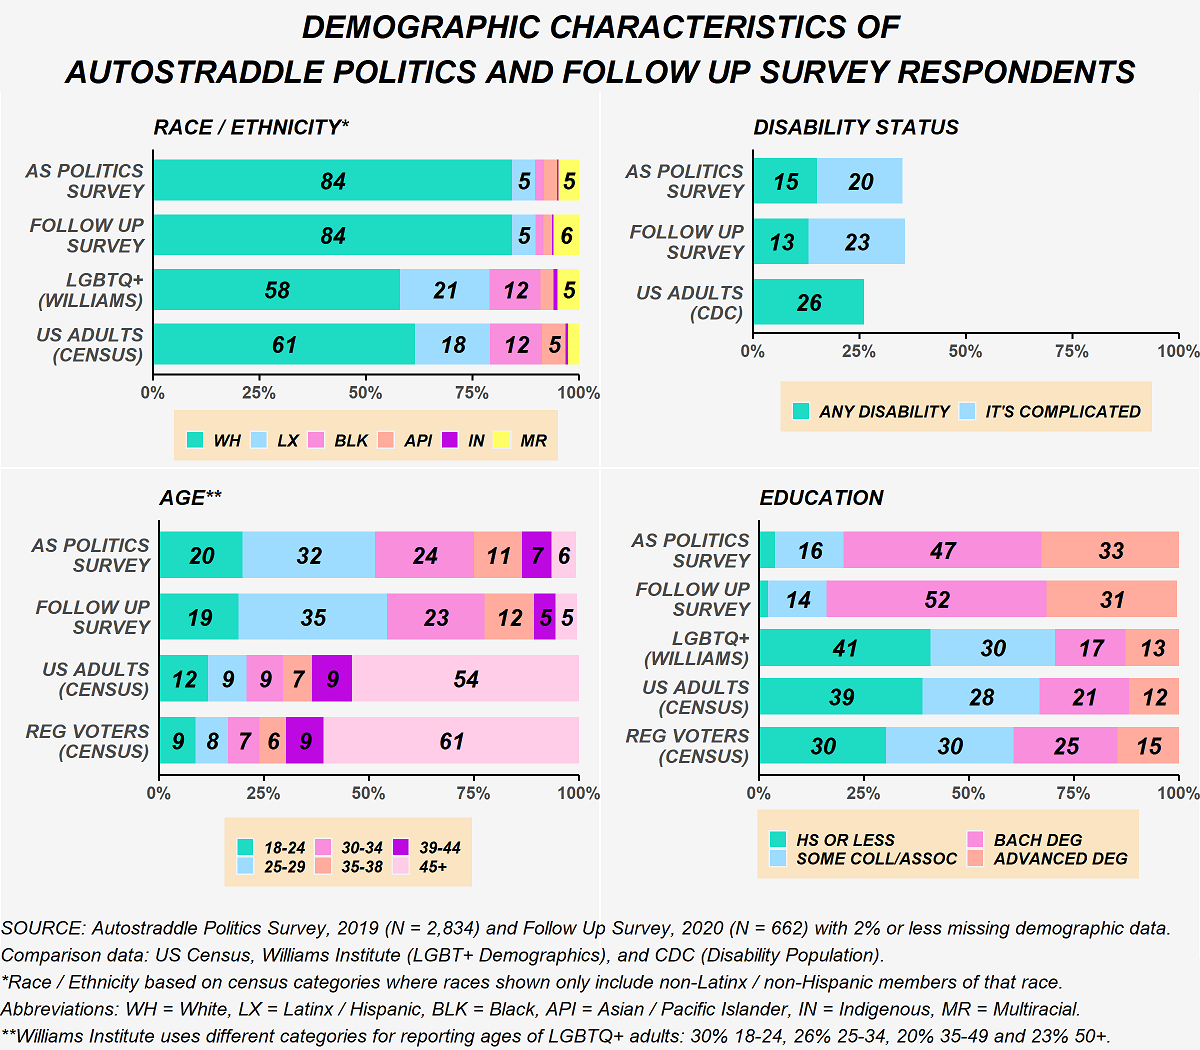
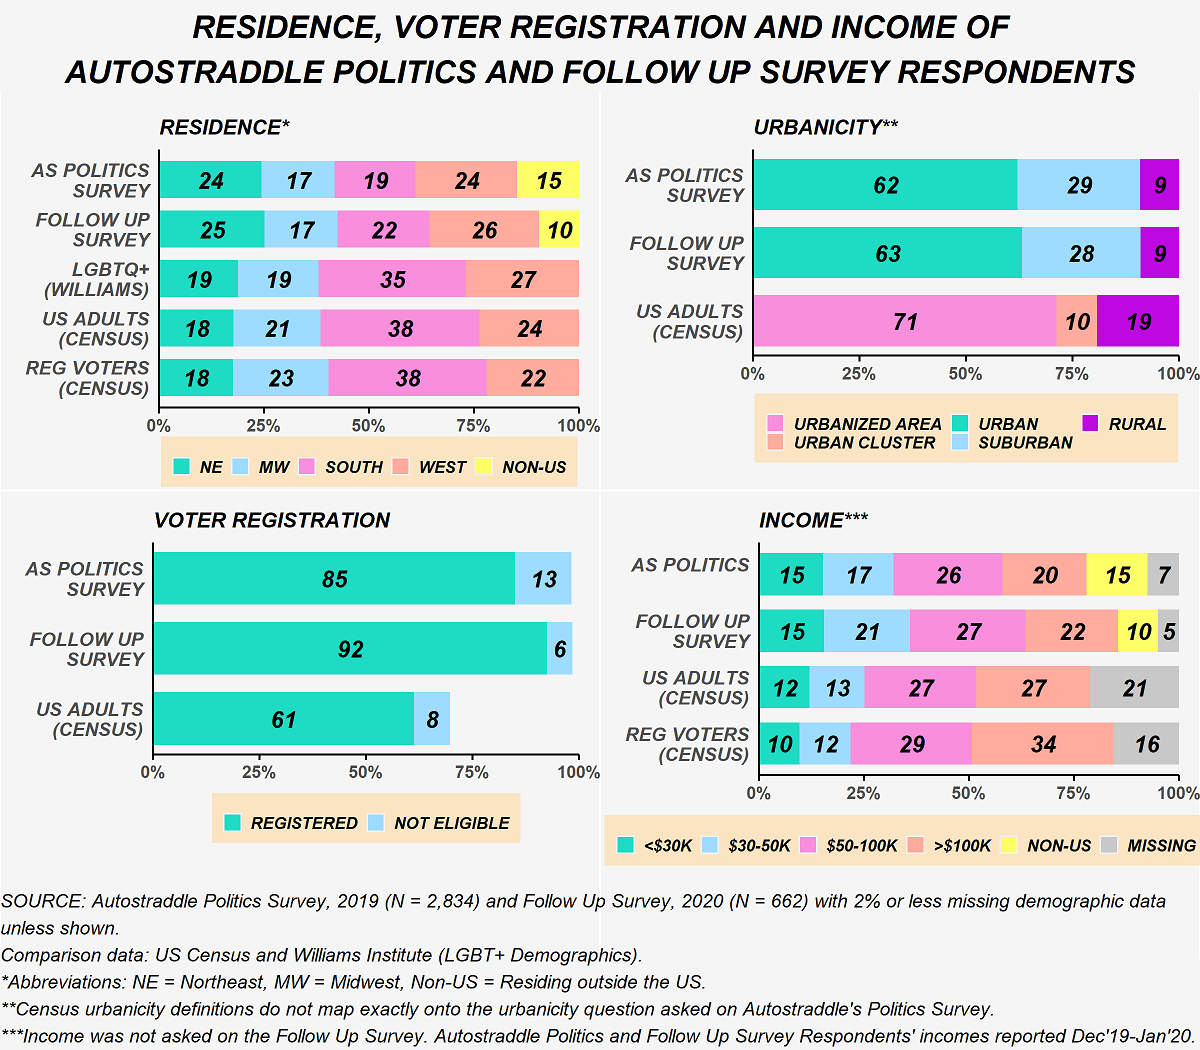
Another key difference is that fewer people living outside the U.S. participated in the Follow Up Survey. As a result, more of the Follow Up Survey respondents are registered to vote in the U.S. Once we account for this difference, the two subsamples are similar in terms of what region they live in. They also live in similar types of places, generally. (Note that the U.S. Census uses “urbanized clusters” and “urbanized areas” in its data collection, which are very different from how most people think about urban and suburban.) In terms of income, there is some variation, even after accounting for the differences in the proportions of non-U.S. residents.
There are, of course, unmeasurable differences between the type of person who would complete a second political survey and the type of person who wouldn’t. That being said, the Follow Up Survey provides important insight into shifts within our community.
“Anyone Who Would Discriminate ‘Based on Their Religious Beliefs’ Should Not be in Health Care.”
Far too often religion becomes the justification for mistreatment in health care, particularly when it comes to LGBTQ+ friendly and, especially, trans-inclusive care and reproductive rights. Based on a poll conducted by The Economist/YouGov in October 2019, Americans are conflicted in their views on a government regulation allowing medical providers to deny services because of their religious beliefs. Those divisions are largely along partisan lines with 81% of liberals opposing such a measure compared to 55% of conservatives supporting it.
Autostraddle Politics Survey respondents were in resounding opposition. Going beyond that question, several people further emphasized in free text comments that providers who have religious qualms about providing services should not be working in health care.
The figure below compares the results from the Politics Survey to the Economist/YouGov poll.

While the topic of religious freedoms in health care specifically didn’t come up in the confirmation hearings, Barrett’s views on religious freedom more broadly are well established. Earlier this week, writers for the Washington Post laid out Barrett’s disturbing history of supporting “preferential treatment” for religious expression. It’s likely, based on her record, that if a case on religious freedoms in health care were to make its way to the Supreme Court, she would rule in favor of those who are denying health care.
It’s also very possible that a case on this exact issue will make its way to the Supreme Court soon. In May 2019, the Trump administration created “conscience” protections that would prevent health care institutions from accessing federal funds if they took disciplinary actions against health care workers who denied services because of their religious beliefs. A few months later, in November of that year, a federal judge struck down the rule.
Anti-Trans Discrimination In Health Care Was Already A Big Problem. And Then the Trump Administration Intervened.
The Politics Survey asked respondents if they had been denied health care because of their gender identity or presentation. Among the overall sample, 5% of respondents said they had been denied services and 8% said they were unsure if that had happened to them.
But those overall numbers mask a deeper story. The figure below shows the stark differences in responses to the question on denial of services by the gender identity of the survey respondent. 50% of our trans women respondents had either been denied services because of their gender identity or presentation or had an ambiguous experience along those lines. About a third of our non-binary respondents shared that experience as well.

In addition to the responses shown above, several people shared other negative experiences in free-text comments, such as being discriminated against in other ways, traumatized and mistreated by trans-incompetent health care providers. Others mentioned putting off health care to avoid mistreatment and discrimination.
In an effort to address some of these issues, in 2016 the Obama administration implemented anti-discrimination protections on the basis of gender identity. In June of this year the Trump administration eliminated those protections. Mere days later, the Supreme Court issued its landmark ruling in Bostock v. Clayton County. In the majority opinion, Justice Neil Gorsuch wrote that discrimination against trans people qualifies as “discrimination on the basis of sex.” Although that case was dealing with employment protections in the Civil Rights Act specifically, the same logic applies to a whole swathe of other legislation, including the Affordable Care Act. In fact, in August, a federal judge struck down the Trump administration’s attempt to end trans health care protections, citing the Bostock decision.
It seems almost inevitable that trans health care protections will find themselves before the Supreme Court sooner or later. And while Barrett’s views on the rights of trans people did not come up in the confirmation hearings, her use of the term “sexual preference” when asked about LGBTQ+ protections speaks volumes about how she views the community as a whole. Though she later apologized for using the term, her ties to a law firm that has fought to legalize discrimination against LGBTQ+ people have also been reported this week.
Reproductive Rights Have Been Steadily Eroded for Decades.
Even before Barrett was nominated, the alarms were sounding that Roe v. Wade would be effectively gutted by a Supreme Court with a conservative-majority. In many ways, it already has been. Abortion is such a hot button issue that any law that gets passed, whether at the state or even a long-shot attempt in Congress, inevitably will make its way to the courts and, often, up to the Supreme Court. That small handful of people wields an incredible amount of power when it comes to reproductive rights.
Barrett’s views on abortion are clear. She has a long history of explicitly opposing the right to choose. Yet, when directly confronted on the issue during the Senate confirmation hearings, she, unsurprisingly, punted, claiming she would not be going in with an “agenda.” I’m not sure how someone who sponsored a “right to life” ad in 2006 can claim to not have an agenda on this topic.
Respondents to Autostraddle’s Politics Survey could not be farther from Barrett in their views. There was near unanimous support for abortion with almost 90% supporting that basic right to choose in all circumstances and another 10% wanting it to be “legal with limitations.” That was, more or less, consistent no matter how I sliced the data. In contrast, a Monmouth University poll from June 2019 found that while nearly two-thirds of American adults want abortion to be legal in some capacity, only 29% fully support it in all circumstances. The figure below compares these results.

The High Cost Of Health Care Hits Our Community Particularly Hard.
Alongside these battles over what medically-necessary services are legally permissible is the fight over the prohibitively high cost of health care. A well-established problem nationally, this is another aspect of the health care system that especially harms our community. The Politics Survey asked whether respondents to indicate whether they or someone in their household had forgone needed services because of they could not afford them. Results from the Politics Survey are compared to a Monmouth poll conducted May 2019 in the figure below. Note that all results discussed in this section exclude Politics Survey respondents who live outside the U.S. because of the policy-specific nature of this issue.
Once again, the overall numbers hide a deeper story. The Monmouth University poll found substantial differences in the response to this question by income, which is unsurprising given that cost is the underlying issue. A similar pattern was observed among Politics Survey respondents, as well. This comparison is shown in the graphic below.

A direct consequence of these disparities in access to care by income level is disparities in access to care by other demographic characteristics that are correlated with income, including gender identity, race/ethnicity and disability status. So while the rate of forgoing health care because of the cost among our community as a whole is 63%, among trans women and non-binary people that rate is 70% and 73% respectively, among Black and Latinx people it’s around 70% and among people living with disabilities it is a galling 78%. Health care is just one more arena where some of the most marginalized members of our community face the dual threats of identity-based discrimination and poverty.
The Growing Appeal of Medicare for All
Several policy ideas have been floated in the last few years to address the high cost of health care. A single public plan like “Medicare for All” has gained substantial traction on the left and dominated much of the conversation during the Democratic primaries. Among Politics Survey respondents, over 80% wanted to move towards a universal public system either immediately or eventually. The American public, of course, is much more divided. The figure below compares responses from the Politics Survey to a Monmouth University poll conducted in August 2019.

Support for a single payer was substantially higher among Politics Survey Respondents than U.S. adults, regardless of income. But, nonetheless, a greater proportion of our lower income respondents wanted to move towards a universal public system at some point than our higher income respondents: 88% of respondents with an annual income below $30,000 compared to 78% of respondents with an income above $100,000. There wasn’t much variation in support for Medicare for All by gender identity, race/ethnicity or disability.
I was curious to see if the pandemic led to any shifts in how people viewed Medicare for All, so this same question was asked on the Follow Up Survey. Among the people who took the Follow Up Survey, support for moving to Medicare for All at some point stayed about the same. The urgency, however, changed. In the Politics Survey (conducted December 2019 – January 2020), 70% of Follow Up Survey respondents said they wanted to get rid of all private insurance compared with 14% who preferred an opt-in with eventual transition to single payer. By the time of the Follow Up (conducted July – August 2020), that had shifted to 77% and 9%. The change is modest but not statistically significant.
The Supreme Court Could Affect Single Payer Health Care in Many Ways
One of the drawbacks of a single payer public health plan is that, depending on who’s in power, it might not cover politically divisive but medically necessary procedures like hormone therapy, gender reassignment surgery or other trans-inclusive care, contraceptives or abortions. If recent history is any model, it’s fair to assume that even if Democrats managed to pass a plan like Medicare for All that covered all of these things (more on that in a minute), private companies would start suing left and right and the matter would make its way to the Supreme Court. Conservatives on the Court have already proven that they will side with religious freedoms at the expense of contraceptive care, as we saw in Burwell v. Hobby Lobby. All evidence suggests they would act exactly the same way if there were a single payer law with a mandate for covering trans-inclusive care or abortions. And we know Barrett will fall even farther to the right on this than the conservatives currently on the Bench.
In addition to legal scrutiny over what could be covered in such plan, a single payer plan will very likely find itself in court for mandating health coverage, the way the Affordable Care Act has on multiple occasions. Here again, history is instructive of what the future may hold. In 2012, the ACA was narrowly saved with Roberts writing the majority opinion. As a legal scholar explained in a recent interview with The New Yorker, a key issue in that case and the one that will be heard by the Court the week after the election is whether requiring people to purchase health insurance is “an unconstitutional act of coercion.” In the 2012 case, Roberts ruled that the ACA, specifically, was not because of the fines imposed on people who did not purchase health insurance (which Roberts viewed as a “tax” and therefore under the purview of Congress). After Republicans did away with the fines in 2017, the latest challenge to the ACA argues that the current form of the ACA is now coercive.
Many are concerned that Barrett’s hasty nomination to the Court will be the end of the ACA once and for all (a Republican dream and Trump campaign promise). In the hearings, Barrett, of course, punted on the issue, but she has previously criticized Roberts’ 2012 opinion that saved the ACA.
It’s hard not to imagine that all of this would replay itself in one form or another if a public, single payer plan were to somehow become the law. Once again, the Supreme Court has tremendous power in determining the shape of health care in this country.
Biden, of course, does not support single payer, though Harris did during the primary. As the pandemic has worn on, Biden’s moved closer and closer towards it. In July, a “unity task force” between the Biden and Sanders campaigns put forward a plan to expand health care access substantially. While not single payer, the plan will lower the qualifying age for Medicare and includes a government-run public health insurance option. That public option would be available to anyone but would automatically enroll low-income people who lose their jobs. Again, what a conservative court will do with such a law remains to be seen.
Is Everything Doomed?
Barrett will be confirmed before the election. Republicans are bending every rule and norm to make that happen. We will have a 6-3 conservative majority on the Supreme Court in a matter of weeks. Roberts’ seemingly liberal sleight of hand votes that have, bit by bit, undermined policies that enshrine basic rights will no longer put off the inevitable. So where do we go from here?
The only say we have over who’s on the Supreme Court is through who we vote into office in the Senate and the Presidency. For his part, Biden continues to dodge questions about court-packing, which leaves us with something to hope for. Last week, Natalie covered the close Senate races; If you have the money or the time, donate to and volunteer to campaign for those races. And after the election, the phones need to start ringing.
AS Politics Survey: Where Our Readers Stand On Criminal Justice Reform
As we head into the 2020 election, our contributing data brain, Himani Gupta, is analyzing data from past Autostraddle surveys to find out what issues are most important to our community and what is currently at stake.
America’s criminal justice system was racist from its inception, but the issue only garners mainstream attention after high profile, tragic murders of Black people at the hands of law enforcement. This summer was one of those moments, with a resurgence of support for the Black Lives Matter movement in the wake of George Floyd’s brutal murder.
Back in December 2019, Autostraddle conducted its first ever politics survey. As I began working the data, the world started changing at an accelerating rate. But many of the key questions at the core of that survey remained: where does this community stand on pressing criminal justice issues including bail, incarceration and police brutality?
We’ll explore those questions using data from the Politics Survey and more recent data from Autostraddle’s 2020 Reader Survey.
Who Took the Surveys?
To make sense of our survey results, we first need to take a look at who took the two surveys!
Both surveys were available online through posts on Autostraddle’s website. The Politics Survey was open from December 3, 2019 through January 10, 2020. Over 4,400 people started the survey and about two-thirds made it to the mandatory questions on gender identity and sexual orientation. The Reader Survey was open July 7 through July 15. Nearly 3,400 people started the survey and over 90% made it to those same mandatory identity questions.
The analysis samples are restricted to LGBTQ+ people who identify as women, non-binary and/or trans living in the U.S. (The criminal justice questions on the Reader Survey were only asked of people who live in the U.S. so both samples were restricted to U.S. residents.) This gives us our final samples of 2,409 people on the Politics Survey and 1,950 people on the Reader Survey.
These are what the stats-y among us call “convenience samples” because anyone online could opt to take the surveys, so there’s self-selection bias. This limits how much we can use these results to make general statements about the political views of LGBTQ+ people who identify as women, non-binary, and/or trans.
The figure below shows the gender identities and sexual orientations of our two samples. We got comparable mixes of respondents of different gender identities both times, though fewer trans women responded to the Reader Survey than the Politics Survey. Respondents are also fairly similar based on their sexual orientations1, although the reader survey had more respondents who identified as lesbian/gay as a whole.

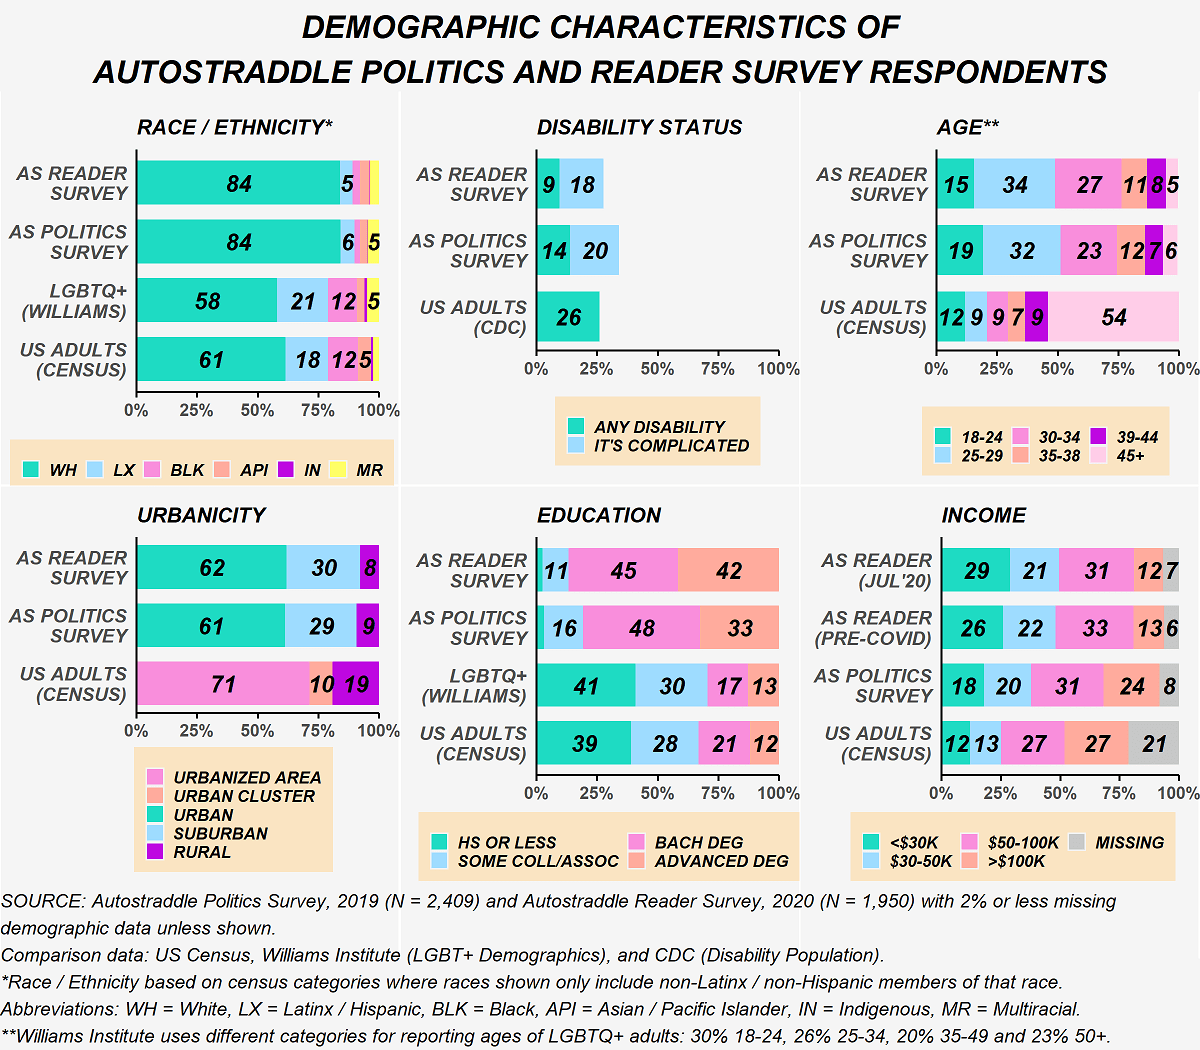
The two samples are similar on some demographic characteristics but share some noticeable differences. The figure below compares the demographic characteristics of our two samples and also provides data on the U.S. adult population (from the Census and CDC) and LGBTQ+ adults in the U.S. (from the Williams Institute) for reference. Respondents to the Politics and Reader Surveys were similar in their racial/ethnic makeup and in the types of places they live in. (Note that the Census uses “urbanized clusters” and “urbanized areas” for reporting, which are substantially different than how most people define urban and suburban.) The Reader Survey had fewer respondents with disabilities than the Politics Survey. Reader Survey respondents were also slightly older and generally had higher levels of educational attainment. The biggest difference is in terms of household income: respondents to the Reader Survey had substantially lower household incomes than respondents to the Politics Survey, even before the pandemic hit.
In addition to these measured differences, the two samples are, by definition, going to be different because of self-selection. It’s very likely that a different type of person might be motivated to take a survey dedicated to political issues in the U.S. (and a fairly long survey, at that) than the type of person who will take a more general reader survey.
Despite all these caveats, there’s still a lot we can learn from these data about our community’s perspectives on criminal justice reform and how that has shifted in the wake of this summer’s BLM protests.
Much of Our Community Was Already Supporting Progressive Stances on Criminal Justice Issues
The Politics Survey asked questions that touched on several aspects of the criminal justice system. The questions were taken from a study by the Center for American Progress (CAP) Action Fund conducted in July 2019 and polls conducted by the Associated Press and NORC at the University of Chicago (AP-NORC) in September 2019 and NPR/PBS News Hour/Marist (NPR/PBS/Marist) in July 2019.
View of the System as a Whole
Two questions taken from the CAP study asked respondents whether they agreed or disagreed with the overarching value propositions that guide the U.S.’s criminal justice system currently: criminalizing behavior and investing in law enforcement. The figure below compares responses from the Politics Survey to the data released about registered U.S. voters. Politics Survey respondents were nearly unanimous in rejecting the positions that guide the U.S.’s criminal justice system, agreeing that “the U.S. relies too much on criminalizing behavior” and disagreeing that spending more money on police, prosecutors and prisons will make communities safer. This stands in contrast to registered voters nationally who were more divided on these two questions.

Substantial Support for Legalizing Marijuana
There’s been a national surge in support for legalizing marijuana in the last several years, with states steadily moving towards passing this policy. The figure below shows how Politics Survey respondents viewed the issue, compared with U.S. adults. Politics Survey respondents largely supported legalizing marijuana. A generally popular issue, at the time of the NPR/PBS/Marist poll, just under two-thirds of U.S. adults also supported the policy; this has largely held constant since last year.

Near Consensus that Bail Creates a Double Standard
Nearly all Politics Survey respondents felt the bail system created “two standards of justice;” this position also had significant support nationally. Bail reform was a big topic at the time, as New York state (most notably) was considering a massive change to its bail system that would eliminate bail for most arrests. (That reform passed and went into effect on January 1 of this year, but in April the state legislature and governor walked it back, a pattern we’ve seen play out a few times, now.) The figure below shows responses from the Politics Survey compared with U.S. voters.

Multiple Perspectives on Incarceration
Politics Survey respondents overwhelmingly rejected the current guiding principles of the criminal justice system and the bail system and think marijuana should be legalized. On incarceration, though, our respondents are more conflicted. The figure below shows their responses to two questions on incarceration. There’s still strong support for reducing incarceration rates and that level of support is higher than the U.S. overall, but there’s a greater mix in Politics Survey respondents’ views on the issue compared to the ones discussed earlier.

Several respondents shared their thoughts in free-text comments on the question specific to those with mental health disabilities or substance abuse problems. A few common themes emerged among those who did not agree with the statement. First, respondents’ position depended on the crime with many saying that violent crimes such as murder and rape warranted incarceration. Second, several felt it was important to clarify that no one should be incarcerated for their mental health or substance abuse problems. Third, many expressed that proper treatment should be provided in the situations where incarceration is warranted.
The view that some crimes do justify arrest and incarceration also appeared in the free-text responses of people who agreed with the statement that people with mental health disabilities or substance abuse problems shouldn’t be incarcerated. Many who agreed with the statement called for increased investment in communities, social services and rehabilitation to addressed the underlying problems currently leading to arrest and incarceration. Several people decried private prisons while others went further and called for full abolition.
Near Consensus that Police Violence is a Problem
Back in December, a large majority (over 80%) of Autostraddle Politics Survey respondents already believed that police violence against the public was an extremely or very serious problem, compared to just over a third of U.S. adults as a whole. This is shown in the figure below.

This isn’t entirely surprising because 29% of Autostraddle Politics Survey respondents said they were worried about being the victim of police brutality and another 8% were unsure (not shown). In contrast, when Quinnipiac University asked registered voters this question in April 2018, only 21% shared those worries while 79% definitively said they were not worried. But, awareness of the issue of police violence among Autostraddle Politics Survey respondents also went beyond personal experiences: there was a near consensus that police are more likely to use deadly force against a Black person. And while that statement is a fact and not an opinion, just over half of U.S. adults actually believed it last September (this June that was up to 61%).
What’s Shifted in Our Community on Criminal Justice Reform
Given the substantial support progressive criminal justice reform issues already had back in December, there were only small pockets of our community that might have shifted their views on these particular questions in light of everything that happened this summer. The Reader Survey asked fewer questions about criminal justice reform. Two were repeated from the Politics Survey. The CAP Survey doesn’t have new results available, but the AP-NORC poll was conducted again more recently in June. A third question was added from a Yahoo News/YouGov poll conducted at the end of May.
Support for Reducing Arrest and Incarceration was the Same on the Reader Survey
Interestingly, there was no change in the proportion of Autostraddle Respondents who agreed that reducing arrest and incarceration rates would make communities safe. We did not ask the question about people with mental health disabilities or substance abuse issues a second time, and there is no new data on U.S. registered voters from the CAP survey. Neither survey asked about prison abolition so we also don’t know how much traction that position has within our community. On the Reader Survey, many people explained their thoughts on this question in free text comments, and the same themes from the Politics Survey emerged.
Police Brutality was Viewed as a More Serious Issue among Reader Survey Respondents
Police brutality was under a spotlight this summer after the murder of George Floyd was followed by video after video of police officers’ violent treatment of Black people and unwarranted responses to protesters. We wanted to see if this changed how our community views police violence. Results from the Reader Survey are shown in the figure below. The proportion who view police violence against the public as an extremely or very serious problem did increase by eleven percentage points between the Politics Survey and the Reader Survey, which is comparable to the shift we see among U.S. Adults nationally. But, as mentioned before, the Politics and Reader Survey samples are clearly different, so it’s hard to know if that shift is indicative of changes in our community’s views on police violence against the public or because different people were asked this question. The truth is probably a little bit of both.

Finally, the Reader Survey asked about defunding police and an overwhelming majority of respondents favored defunding. In free-text comments, many people went further and wanted to see full abolition. While in stark contrast to the U.S. nationally, this position doesn’t come entirely as a surprise based on the other perspectives on criminal justice issues shared in the Autostraddle Reader Survey, and the overwhelming support for progressive criminal justice positions observed on the Autostraddle Politics Survey.
Summing Up: How Our Community Compares to the U.S. Nationally
Clearly, there are substantial differences between where our community stands on these issues compared to the U.S. overall. That was strikingly true in December 2019/January 2020 and it remained true in July 2020. But as we saw earlier, our community is strikingly different from the U.S. population. Our group is quite a bit younger, quite a bit more educated, quite a bit less affluent, quite a bit whiter, quite a bit less likely to live in a rural area and quite a bit more likely to vote Democrat. While it’s true that younger, less affluent people who live in urban areas and vote for Democratic candidates are more likely to look at the criminal justice system from a progressive reform or abolition lens, even when accounting for those characteristics, our respondents were still in favor of substantive criminal justice reform at much higher rates than their counterparts nationally. (Also, on the flip side, white people, nationally, generally view progress criminal justice reform propositions less favorably than Black or Latinx people.)
With Such Overwhelming Consensus on These Issues, Any Differences within Our Community are Largely Undetectable
At this point, some of you may wonder whether there were any meaningful differences within our community. Are trans women and non-binary people, for instance, more likely to be in near- unanimous consensus on these issues compared to cis women? What about people who identify as lesbian or gay versus those who identify as bisexual, pansexual or sexually fluid versus those who identify as queer; or people who identify as asexual or on the ace spectrum compared to those who don’t? Race and ability have to factor into all of this as well, right? Certainly, these are questions I had.
I looked at all of this, and more, and the tl;dr is there was no indication of differences based on the identity characteristics of our respondents.2 There was some evidence to suggest some differences by age, with people aged 45 or older being more likely to take a middling position (for example, “neither agree nor disagree” or the issue is a “moderately serious” problem) than younger respondents. However, while the differences were substantively meaningful – for instance 66% of Reader Survey respondents aged 45 or older agreed on the question on reducing incarceration and arrest rates to keep communities safe, compared to 88% of Reader Survey respondents under the age of 29, and the same was true on the Politics Survey – the differences were not statistically significant due to the relatively small number of people on our surveys in the 45 and older age group. So there’s some suggestive evidence that something might be going on by age, which aligns with what we know to be true nationally as well.
What all of this tells us is that while there are differing perspectives in our community on the criminal justice system, the drivers of those differences don’t seem to be identity factors, by and large.
Beliefs in Action
The Reader Survey asked if respondents supported the Black Lives Matter movement and a near unanimous 98% said they did. This support did manifest in concrete actions related to race and racial equity. Some of the actions taken by Reader Survey respondents are shown in the figure below, with national comparisons from a survey conducted by the Pew Research Center in June 2020.

In a follow up question, nearly 85% of Reader Survey respondents who hadn’t attended a protest or rally said they didn’t because of concerns about spreading or contracting COVID-19; 15% indicated that accessibility was an issue as well (respondents could select more than one answer for this question).
Our community wants to see real, meaningful change when it comes to the criminal justice system. The upcoming U.S. elections are an opportunity towards building that. So much of what happens with the criminal justice system is in the hands of local and state governments. We’ve seen this play out time and again this year, from the bail reform effort in New York to Minneapolis City Council’s attempt to dismantle the police department to Austin’s reduction of the police budget. Many of the policies discussed here are decided by lower level, elected public officials and others are directly on the ballot. Check out this guide from “What’s on the ballot?” for information on district attorney races and state supreme court seats as well as ballot measures on drug policy, policing and more.
Voting — at all levels — is an important first step towards turning these beliefs into policy. Honestly, no one has said this better than these strippers from Atlanta:
1Sexual orientation was asked differently on the two surveys. On the Politics Survey, respondents were asked to select the sexual orientation they most strongly identified with from the following list: lesbian, queer, bisexual, pansexual, sexually fluid, asexual (or similar), gay, straight or other; they were then asked to select any other sexual or romantic orientations they identified with (same options as before plus: homoromantic, panromantic, biromantic, aromantic and heteroromantic). On the Reader Survey, respondents were first asked if they identified as asexual or on the asexual spectrum. Then, all respondents were asked to pick the term that best described their sexual / romantic orientation from the following list: lesbian, queer, bisexual, pansexual, sexually fluid, gay, straight, not sure or other. To align these, the Politics Survey data was recoded as follows: anyone who identified as asexual or aromantic on either of the two questions (or indicated an asexual adjacent orientation such as demisexual or graysexual in the free text) is considered part of the “Ace spectrum” group. For those who indicated they are asexual on the first question, their responses to the second question were analyzed to see if they could be recoded as any of the other sexual orientations. If they selected more than one or if they only indicated asexual/aromantic then they were included in the “other” category.
2 For the stats people: The results were not statistically significant by and large. There were nine different measures. Looking at the overall results, there’s no way there would be variation by demographic on the questions about bail, criminalizing behavior to make communities safe, spending more money on the criminal justice system to make communities safe or police use of deadly force against Black versus white people. This leaves us with five measures where there could be differences. However, because so few people selected “disagree” or “oppose,” most of the tests failed to calculate properly due to low sample. Basically, there just isn’t enough variation in the data to indicate statistically significant differences. On income, one measure was significant, but I didn’t count that since the others were either not significant or were inconclusive (in an attempt to acknowledge multiple hypothesis testing issues). Sexual orientation did turn up significant differences when I excluded the “other” orientations category, but they were qualitatively meaningless and more likely artifacts of the large sample size than true differences (the largest difference was 8 percentage points). The one exception to this (age) is discussed in the text.
Warren Leads Autostraddle’s Politics Survey, Sanders Is Second and Everyone Else Is Far Far Away
Primary season is officially upon us! With the clusterf*ck that is the Iowa Caucus continuing to unfold and results now in from New Hampshire, what better time to talk about who the LGBTQ+ women and non-binary people right here and right now (well actually in December) want the next president to be?
Results are in from Autostraddle’s Politics Survey, and Elizabeth Warren is unquestionably the favored candidate! No matter how many ways I look at this data, that story doesn’t change.
How Much of a Lead Does Warren Have?
We asked respondents which presidential primary they would vote in, regardless of if they could vote in the US; 96% said they would vote in the Democratic primary. Among those 96%, we asked who their top choice candidate was and to select all of the candidates they had a favorable impression of. It’s also important to note that this survey first went out on December 3rd, and since then, many candidates have left the race, and some survey-takers may have changed their minds.
I’ve combined the results of the top choice and favorability questions in the chart below. The green portion of each bar shows the proportion of Autostraddle’s Politics Survey respondents who picked that candidate as their top choice. The blue portion of the bar shows how many respondents indicated they had a favorable impression of the candidate, even though that candidate wasn’t their top choice. I’ve excluded candidates who were rated favorably by less than 4% of our respondents.
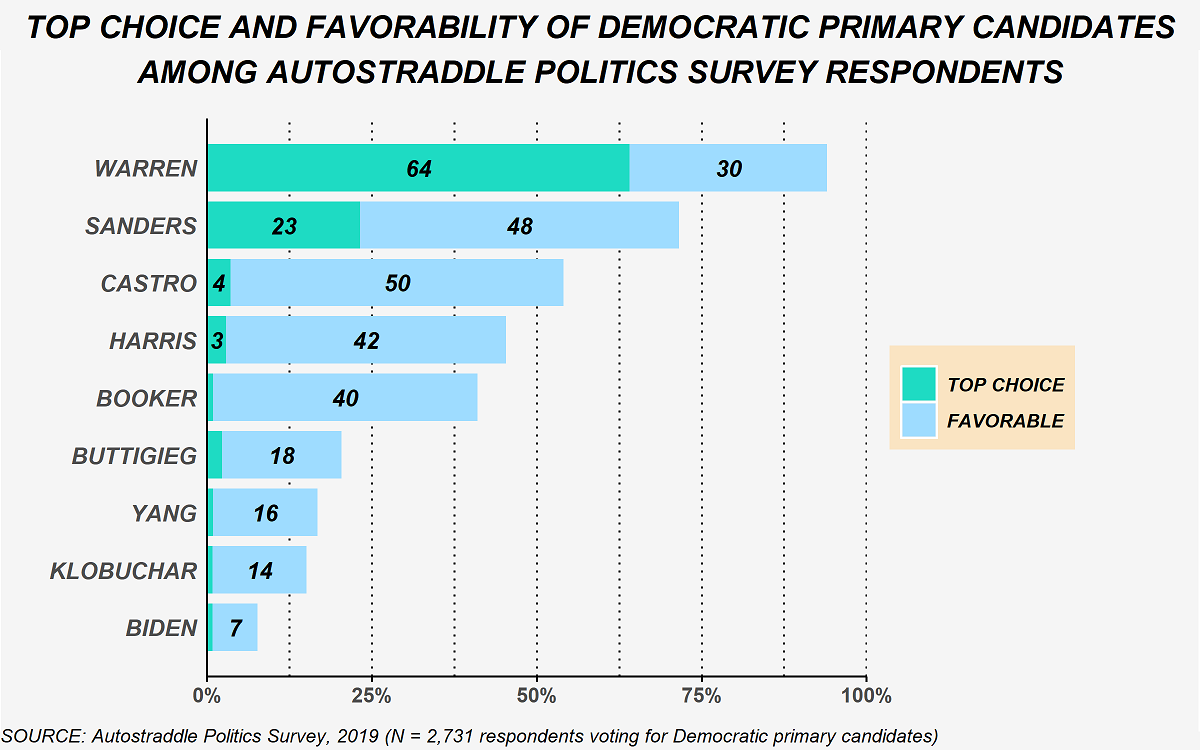
Warren far outpaces the other Democratic nominees with 64% of respondents choosing her as their top choice. Bernie Sanders comes in second place, as the top choice of 23% of respondents, and everyone else was the top choice of 4% or fewer of our respondents.
Respondents were split nearly evenly when asked if they would definitely support their top choice candidate or if they might change their mind, which makes the overall favorability of candidates an important measure to look at. In total, 94% of respondents viewed Warren favorably, with the majority picking her as their top choice. Sanders comes the closest to Warren, with a total of 71% of respondents viewing him favorably or selecting him as their top choice candidate.
Since the survey launched, Kamala Harris, Julián Castro, Marianne Williamson, Cory Booker, John Delaney, Andrew Yang, Michael Bennet and Deval Patrick have suspended their campaigns. Over 6% of our respondents picked Castro or Harris as their top choice. We didn’t ask about second choice candidates, but we can look at the favorability ratings to get an idea of who those 6% of respondents might support among the candidates still in the race.
The chart below shows the favorability ratings of the candidates still in the race, among our respondents who selected Castro and Harris as their top choice. Once again, Warren leads the pack, with nearly 85% of both groups having a favorable impression of her. Sanders does better among top-choice Castro respondents than top-choice Harris respondents (57% versus 42%). Less than 15% of top-choice Castro respondents viewed any of the other candidates favorably. Top-choice Harris respondents, on the other hand, were more willing to give other candidates a chance, with sizable proportions of this group having favorable impressions of Amy Klobuchar, Pete Buttigieg and Joe Biden.
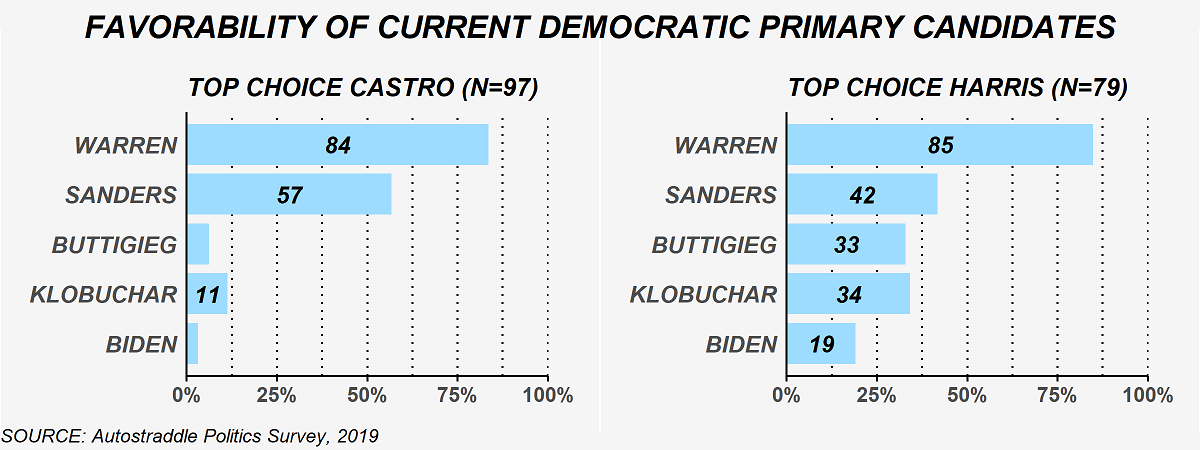
One thing that stands out from the chart above is how Warren appears to appeal to respondents with differing ideological stances, given that Castro and Harris had different positions on a number of issues. Warren has positioned herself as the unity candidate, and this seems to play out among our respondents more broadly as well.
On the 2016 Autostraddle Reader Survey (conducted after the primary), 52% of respondents said they voted for Sanders in the 2016 Democratic primary and 46% said they voted for Clinton. We captured a similarly mixed group in our recent politics survey. Of the respondents to Autostraddle’s Politics Survey who said they could vote in the 2016 primary, 47% voted for Clinton, 41% voted for Sanders and 13% did not vote in the primary election. And when we look at their top choice candidate in 2020, a majority of each of these camps selected Warren: 81% of Clinton voters, 53% of 2016-Sanders voters and 62% of respondents who didn’t vote in the 2016 Democratic primary.
Out/YouGov’s poll conducted last November also found Warren and Sanders to be the leading candidates among LGBTQ+ voters but with much smaller margins, with Warren getting 31% of the vote and Sanders 18%. Biden and Buttigieg both did far better on the Out/YouGov poll than they performed among our respondents. That poll looked at the LGBTQ+ community as a whole, however, and did not disaggregate results by gender identity, which makes it hard to compare to our survey focused on people who identified as queer women, non-binary, and/or trans.
On the other hand, Whitman Insight/Buzzfeed’s poll of LGBTQ+ Americans conducted last June had Warren behind Sanders and Biden and tied for third place with Buttigieg. That poll did disaggregate results by gender identity and sexual orientation. I’ll compare our results by sexual orientation to the Whitman Insights/Buzzfeed results in more detail below. (Gender identity was handled differently on that poll than how we asked it, so it’s hard to compare those results.)
Let’s Talk about Electability
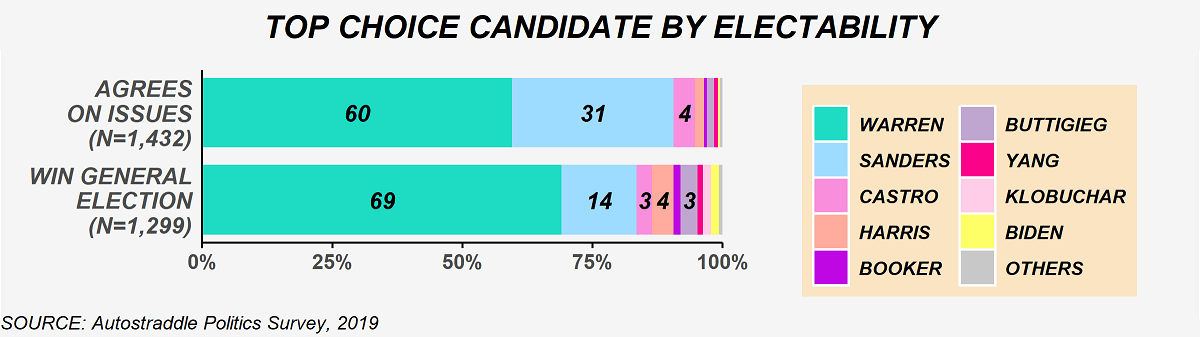
We also asked survey takers what was more important to them: a nominee who agreed with their positions on most issues, or a candidate who could win the general election? Some of you were so mad we asked this question!
Respondents to our politics survey were split almost 50-50 between the two options. According to the latest national polls, we’re either just as concerned about electability as the rest of the country (according to the Quinnipiac poll conducted February 5 to February 9) or much less concerned about it (according to The Economist/YouGov poll conducted February 2 to February 4, which found that 71% of Democratic primary voters wanted a candidate who can win in November). Who even knows where the truth lies?
As a few people pointed out in their comments, the electability debate is often a cover for misogyny and racism. This came into the limelight about a month ago when a private conversation between Warren and Sanders that allegedly touched on the electability of a woman for president became the focus of the pre-primary news cycle. Electability is an ambiguous, poorly defined concept that has gotten a substantial amount of attention this primary season. At this point, I think you can find an article making the case that every candidate both is and is not “electable,” though the extent to which “not being electable” affects the viability of a campaign certainly changes when the charge is leveled at women or people of color by the mainstream media.
Our poll bears out the notion that maybe electability is just in the eye of the beholder. About 30% of our respondents who prioritize winning the general election have mixed views on which candidate can make that happen, but nearly 70% think that Warren is that person.
Warren has hovered in the 14 to 16 percent range on national polls since the end of November and her ratings appear to have taken a downturn in the last week, according to RealClear Politics. Before the Iowa caucuses, the focus was squarely on Sanders and Biden as the front runners. The Associated Press still hasn’t declared a winner in Iowa yet because of issues with the vote count, the very small difference between votes cast for Buttigieg and Sanders, and the requests for a recanvas from both of those campaigns. Sanders and Buttigieg again led in New Hampshire, and Klobuchar came out with delegates in third place.
Clearly, the queer folks who responded to our survey feel otherwise. But is that true for all of our community?
Demographics
Before we get into breaking the survey results down by smaller demographic groups, a bit about who took the survey and how.
Autostraddle’s Politics Survey launched on December 3, 2019 and was open until January 10, 2020. It was available for anyone to take online through a post on Autostraddle’s website. (For the stats-y people among us, yes, this is a convenience sample.) Over 4,400 people started the survey and about two-thirds made it to the mandatory questions on gender identity and sexual orientation towards the end of the survey. (Yes, it was very long.)
Our analysis is restricted to people who completed the survey and identified as queer women, non-binary, and/or trans, which gives us our sample of 2,834 respondents.
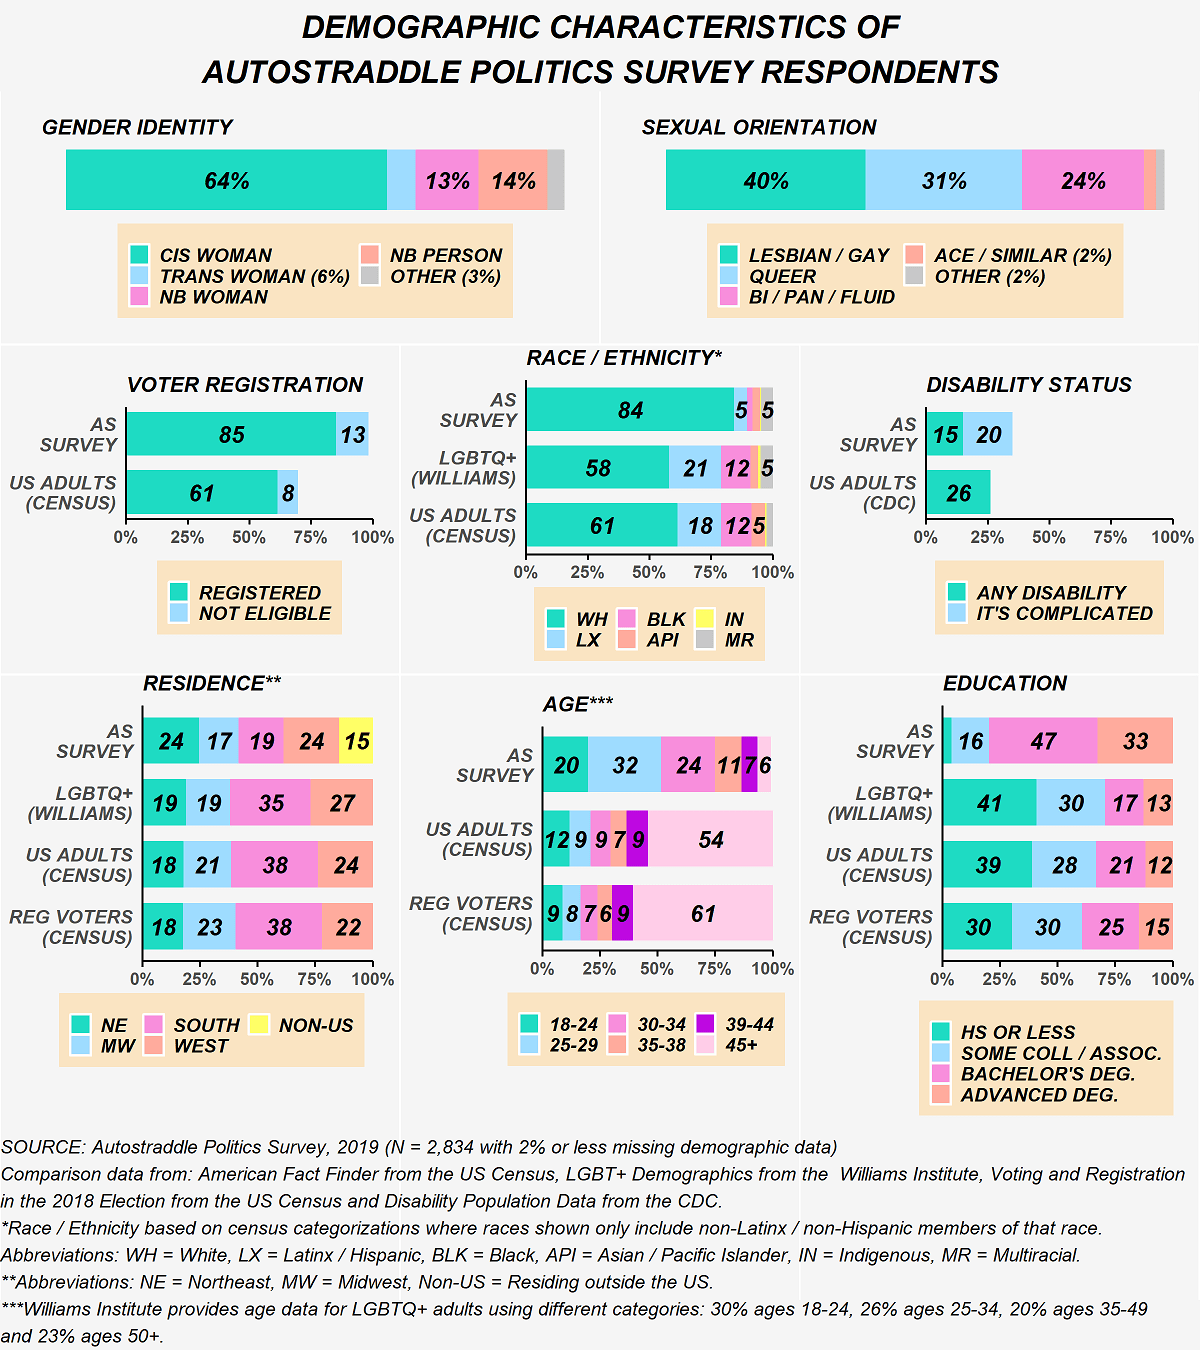
The chart below shows key demographic characteristics of our respondents and compares them to the LGBTQ+ people in the US using data from the Williams Institute and the US adult population using data from the Census and data from the CDC. More details on the demographics of our respondents are available in the extended demographics document.
Warren Leads Across The Board, But Size of Lead Varies By Demographic Group
Our respondents are a varied group and some populations are quite small. Disaggregating the results by demographic characteristics is important so that we don’t lose the voices of different members of our community. Warren remains in the lead with every sub-group I analyzed besides educational attainment (Bernie has a slight lead with people who don’t have bachelor’s degrees), but there are still variances in how much of a lead she has.
Cis Women Least Likely to Choose Sanders as Their Top Choice
More than half of our respondents selected Warren as their top choice, regardless of gender identity, but there are some meaningful differences by gender identity in terms of how many respondents preferred Warren versus Sanders.
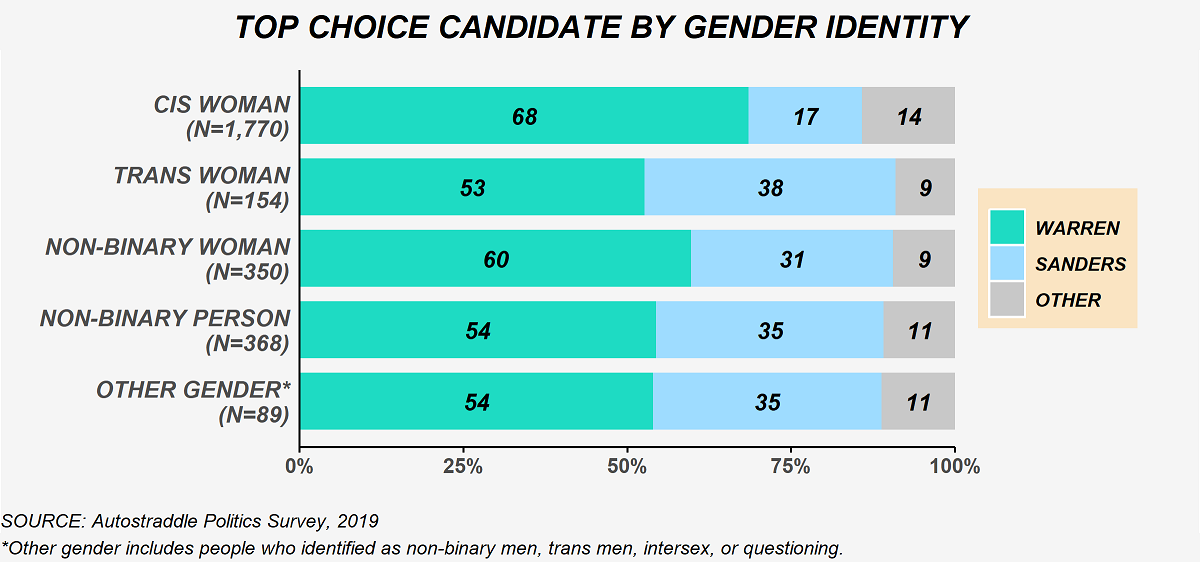
Cis women especially seemed to prefer a Warren candidacy and were the least likely to pick Sanders as thier top choice, with several selecting one of the other candidates instead. In fact, a third of cis women didn’t even rate Sanders favorably, compared with a fifth or less of our respondents of any other gender identity.
Sanders does much better among trans women and non-binary people, with 38% and 34% of those respondents, respectively, choosing Sanders as their top choice. Warren is the top choice candidate for just over half of these two groups. Compared to the candidate preferences of cis women on the one hand and trans women and non-binary people on the other, non-binary women fall somewhere in the middle.
Some of the differences by gender identity that we’re seeing on our survey are related to age, but that’s not the only explanation. I’ll discuss this in more detail below, but Sanders has a stronger showing among our younger respondents. The extended demographics document shows that non-binary people who took our survey are younger than people of other gender identities. Our respondents who are cis women and non-binary women are fairly similar in age, and we even have a higher proportion of trans women respondents over the age of 35 than cis women respondents. Differences in the age ranges of people of different gender identities is part of the story, but it definitely isn’t the only explanation for why our respondents differ in their support of Warren and Sanders by gender identity.
As we saw earlier, respondents less concerned with electability were more likely to choose Sanders as their top choice. Breaking that down by gender identity, about two thirds of both non-binary people and trans women respondents wanted a candidate who agreed with their position on most issues, compared with just under half of cis women and just over half of non-binary women. But even among the non-binary people who were less concerned about electability, a greater proportion picked Warren; among trans women less concerned about electability the two candidates were basically tied.
Not a Whole Lot of Differences by Sexual Orientation
We see some differences by sexual orientation between the proportion of respondents choosing Warren and Sanders as their top choice, but nothing drastic.
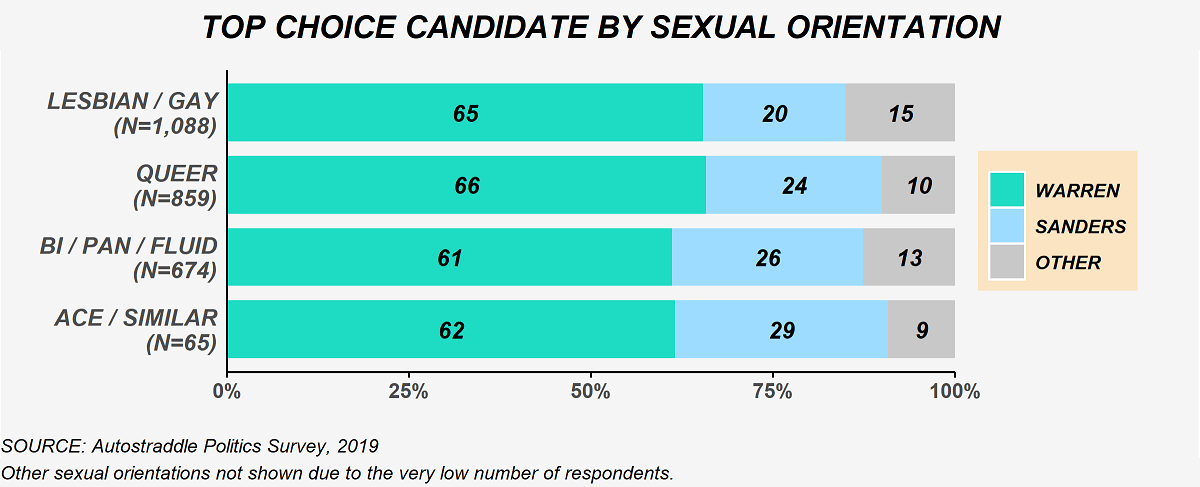
The slight differences we see between the proportion of lesbian/gay and the proportion of queer respondents choosing Sanders as their top choice can partially be explained by the sexual orientation identification of people of different gender identities (see the extended demographics document). Sanders’s slightly stronger performance among bisexual, pansexual, and sexually fluid respondents appears to be in-line with the Whitman/Buzzfeed results, which showed a higher proportion of bisexual people voting for Sanders than lesbian or gay people. Sanders is also the top choice for a greater proportion of our asexual or similarly-identified respondents.
The Appeal of Candidates Other Than Warren or Sanders Differs by Race/Ethnicity (When They Were Still in the Race)
Differences by race/ethnicity are much harder to draw conclusions from because of the small number of non-white respondents on our survey. Nonetheless, the limited data we do have seems to suggest some differences in candidate preferences by race/ethnicity.
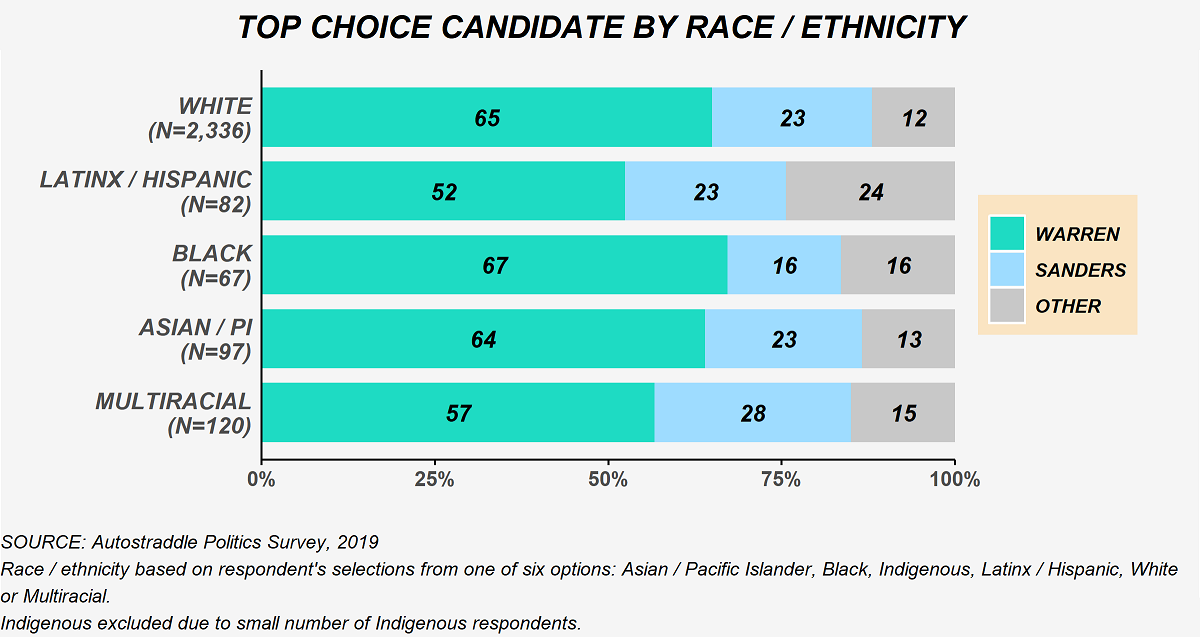
Warren was the top choice candidate for a majority of our respondents regardless of race/ethnicity, but she did better with some races/ethnicities than others. Our Latinx/Hispanic respondents were the least likely to pick Warren as their top choice and the most likely to pick candidates other than Warren or Sanders instead, with Castro and Harris each receiving just about 10% of Latinx/Hispanic respondents’ top choice selections. (When our survey launched, Castro and Harris had not yet suspended their campaigns, and earlier I showed how top-choice Castro and top-choice Harris viewed the candidates still in the race; the number of Latinx/Hispanic respondents who preferred Castro or Harris is too low to look at their responses separately.) In contrast, Sanders leads among Hispanic voters in the latest national polls from Morning Consult conducted between February 4 and February 9, and The Economist/YouGov.
Our Black respondents appear the least likely to pick Sanders as their top choice. That said, we had a relatively low number of Black respondents to our survey – just 67 said they would vote in the Democratic primary. The latest The Economist/YouGov poll shows Warren performing better than Sanders among Black voters. The slightly more recent poll from Quinnipiac, however, finds Warren in fifth place among Black voters, getting just 8% of the vote from that demographic. The latest Morning Consult poll similarly has Warren polling at 8% among Black voters. All three of these polls have Biden continuing to be the candidate this constituency is most likely to vote for, but Biden is losing some of his lead to a rising Michael Bloomberg.
As always the polls are full of noise, and it’s hard to know whether the differences we’re seeing between the polls are in response to current events – Bloomberg has spent nearly $8 million on ads in North Carolina alone – or if this is just another blip in all the data. It’s also worth keeping in mind that our respondents are much younger than all of the national polls, which try to mirror the landscape of registered voters or (even more intangible) “likely” voters. The demographics chart above shows that over 60% of registered voters are 45 or older, compared with just 6% of our respondents in that age range.
Multiracial respondents were the most likely of any racial or ethnic group to pick Sanders, with 28% of them selecting him as their top choice candidate. Our multiracial respondents are varied, with biracial Latinx + white and biracial Asian/Pacific Islander + white being the two largest groups.
Warren Has a Smaller Lead among People with Disabilities
Once again, Warren was the top choice candidate for more than half of our respondents who reported living with a disability or indicated the situation around that was complicated. Yet we see that Sanders clearly does better among those living with a disability or who said the situation is complicated than those who aren’t living with a disability.
Those respondents were also more likely to pick Castro, who was the top choice candidate of 7% of our respondents living with a disability and 5% of our respondents who said the situation is complicated, compared to just 2% of respondents not living with a disability.

We didn’t have free-text boxes related specifically to disability rights, but a few people living with disabilities emphasized how critical Medicare for All was for them as an issue when it comes to the primary.
Disability rights are finally starting to get the attention and engagement they deserve, with several candidates releasing disability policies. Castro (before he dropped out), Warren, and Sanders, in particular, developed comprehensive plans that addressed issues disability rights activists have been highlighting for years – that the challenges facing people with disabilities go beyond healthcare and include discrimination in employment, housing, and education.
People with disabilities turned out to vote at higher rates in the 2018 congressional elections than prior years, and are expected to be a key constituency in the 2020 election. At this point, I haven’t been able to find any polls showing the candidate preferences of people with disabilities, but drop a note in the comments if you know of one.
Results by Other Demographics
I looked at results by region, age, education and income because our survey under-represented certain groups based on these characteristics. In almost every single one of these cuts, Warren is the top choice candidate of the greatest proportion (in most cases, the majority) of respondents. Pretty much all of the differences we see are about how much of a lead she has among a particular demographic.
The results are fairly consistent across regions, with Warren in the lead across the board. Western US residents and non-US residents were more likely to choose Sanders as their top choice, whereas southern US residents were more likely to pick another candidate. In national polls, the northeast is Sanders’ stronghold. A greater proportion of our respondents living in rural locations also supported Sanders compared to respondents in urban and suburban areas.
Sanders leads national polls by a wide margin among people aged 18-29. (He has a 25 percentage point lead within this group, according to the latest The Economist/YouGov poll.) Among our respondents aged 18-24, Warren just barely edges out Sanders 45% to 42%, but Warren has a much stronger lead with those aged 25-29 (65% Warren, 26% Sanders), and she is even stronger among our respondents aged 30 or older.
By education level, Warren was strongest among our respondents with more degrees, whereas Sanders did better among those who don’t have a bachelor’s degree and even had a slight lead among those who had earned up to a high school diploma as their highest credential. Sanders’ strong showing among people with fewer educational credentials is consistent with national polls.
Nearly 40% of respondents with annual incomes less than $30,000 selected Sanders as their top choice compared to just over 50% choosing Warren. Those earning between $30,000 and $50,000 per year, however, more clearly preferred Warren, with just over 20% picking Sanders as their top choice.
At the End of the Day, Trump Has Got to Go
With nine months to go until the general election and a primary season that started over a year ago with no end in sight, it can feel like the divisions within the Democratic Party are too substantial to bring a coalition together. Yet almost all – over 97% – of our respondents asserted that they will vote for whoever wins the Democratic nomination over Trump in the general election; this was the case regardless of the demographic characteristics of our respondents.
That’s not true nationally, though. About 10% of respondents on the latest The Economist/YouGov poll said “it depends” when asked if they would vote for Trump or for whoever the Democratic Party candidate ends up being. Hopefully, that begins to shift once Democrats have a candidate, but we can’t count on that alone. This year I’m committed to donating to Stacey Abrams’s organization Fair Fight, writing postcards and participating in get out the vote drives. What’s your plan?