

Header by Rory Midhani
Feature image via shutterstock
In my very first industrial engineering class during undergrad, we were given an overview on “problem solving 101.” We used manufacturing-specific case studies, but the broader takeaway was this: you cannot make improvements to a system without knowing its current state. If you fail to establish a baseline, any other actions you take will essentially be wasted effort — because when all is said and done, how will you know whether you’ve made things better or worse? The first step to problem solving is to gain a clear understanding of the issue, and to lay it out in such a way that progress, improvements and setbacks can be tracked. Obviously this isn’t possible (or practical) to follow in every situation, but I do think this approach provides a solid framework for system improvements in a variety of contexts — including social justice and LGBT-relevant causes.
One example that comes to mind is the GLAAD’s Network Responsibility Index, an annual review of LGBT representation on TV. Reports were shared both with the general public and in direct conversation with the networks, pushing them year over year to increase the numbers of LGBT characters and stories on screen. Following a decade of tremendous progress, GLAAD issued its final NRI in 2015, determining that the report’s primary quality metric (“are LGBT people being pictured on TV”) was being met. GLAAD continues to track diversity and quality of depictions in its Where We Are on TV report.
In contrast, we have GLAAD’s annual review of LGBT representation in major Hollywood films, the GLAAD Studio Responsibility Index. When I covered the inaugural report in 2013, there were only a handful of movies with queer female characters. Results were similarly dismal in 2014, 2015, and 2016, and even a cursory glance at the data makes one thing very clear: the top seven major motion picture studios are neither providing sufficient LGBT representation, nor are they trending in the right direction. This doesn’t mean that the report is a failure! On the contrary, it’s doing exactly what it’s supposed to do: shining a light on the problem. GLAAD’s report is an immensely valuable tool, and continued tracking will help advocates hold the studios accountable.

On a more sober note, LGBT activists are also doing research and using data to track real life discrimination and violence against members of our community. In the past week, two standout reports have been released: Unerased by Mic, and the 2015 U.S. Transgender Survey by the National Center for Transgender Equality.
Unerased: Counting Transgender Lives is a comprehensive database of transgender Americans who have been murdered since 2010. Using data collected by the National Coalition of Anti-Violence Programs as a starting point, Mic assigned a team of five reporters to review news reports over the past seven years and conduct additional reporting to find out more about each victim and identify patterns that could help combat the problem. Reports Meredith Talusan,
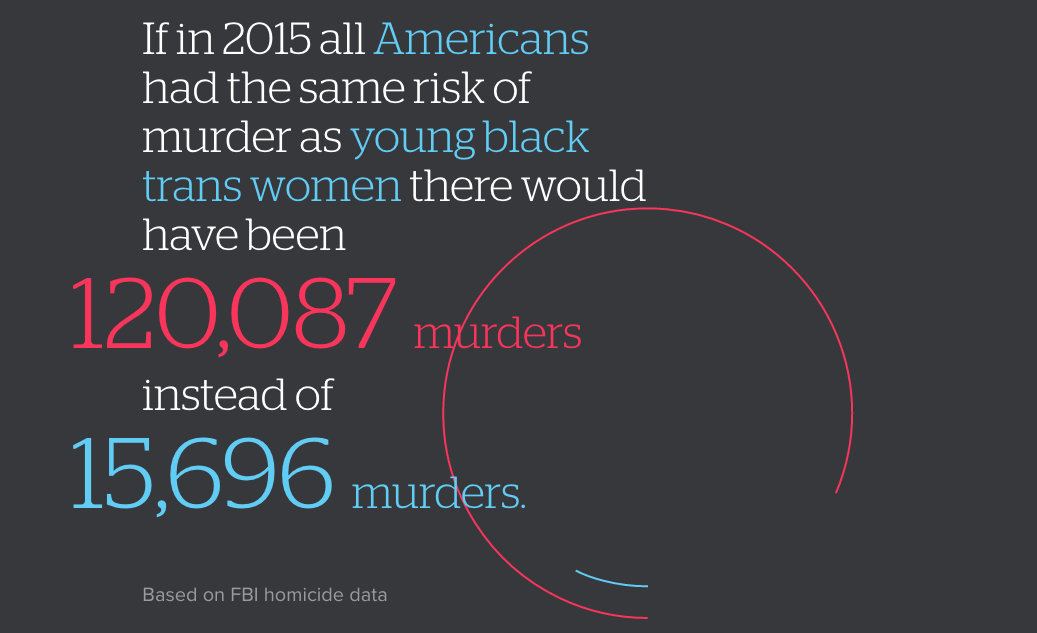
From 2010 to 2016, at least 111 transgender and gender-nonconforming Americans were murdered because of their gender identity, 75% of them black trans women and gender-nonconforming femmes, who identify as neither male nor female but present as feminine. No group under the LGBTQ umbrella faces more violence than transgender people, who accounted for 67% of the hate-related homicides against queer people in 2015, according to the NCAVP.
But it’s difficult to know the full scale of the problem. When a transgender person is killed, each step in the process of accounting for their death risks erasing that person’s gender identity. … [Although there has been better data in recent years], what’s less clear is if the number of violent incidents is actually increasing along with the rate of reports about them. Without a log of historical data, it’ s hard to know how today’s anti-trans violence compares to even a decade ago.
While that particular challenge makes it difficult to rely on this data for baseline incident rate (ex: “more trans people were killed this year versus a previous year”), it is a fully appropriate source for assessing other patterns in anti-trans violence. This dataset overwhelmingly confirms an intersectional effect due to race, for example. Awful as it is to watch this database of tragedies grow, the fact is, anti-trans violence will continue to be carried out whether we are watching or not. Collecting data on the extent and nature of the problem is one way to fight back.
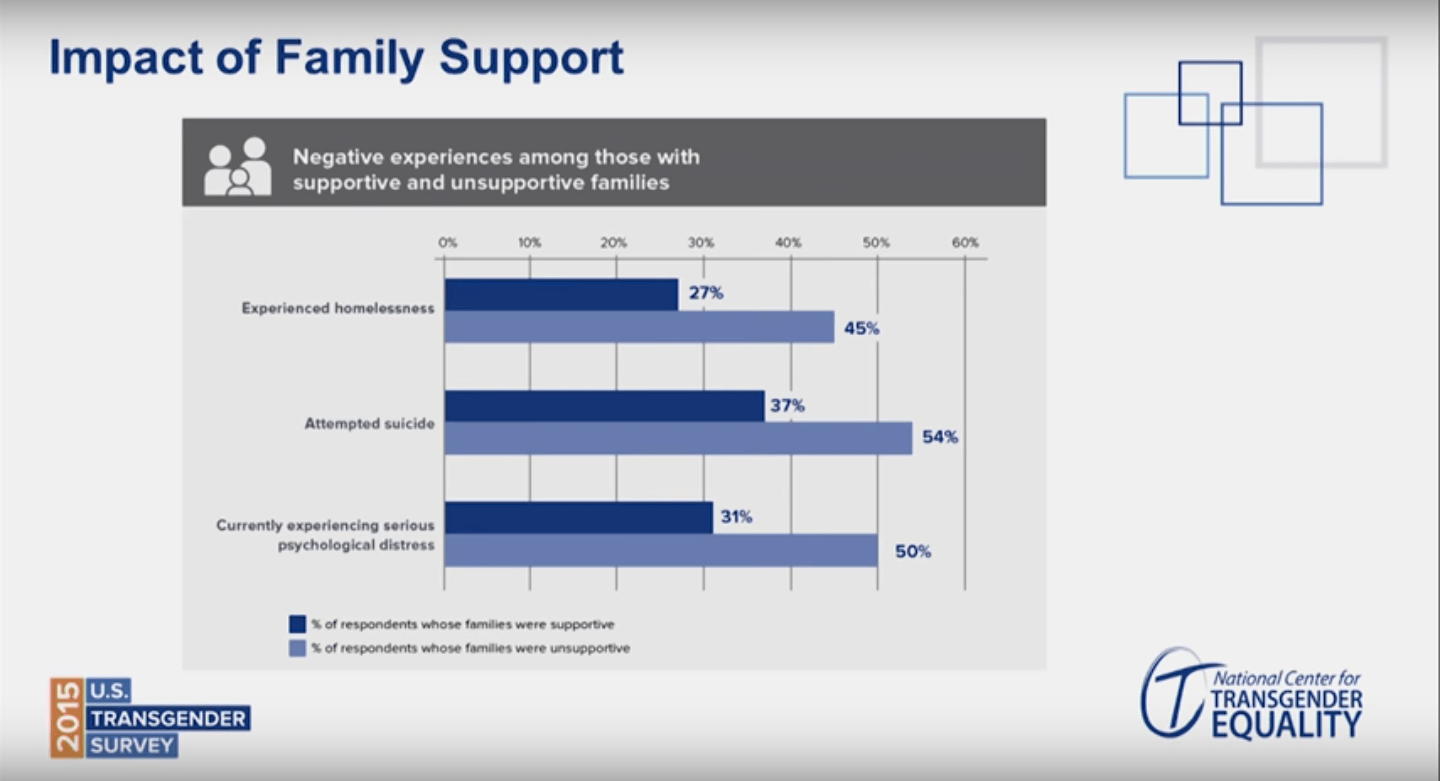
On the same day Unerased was announced by Mic, the National Center for Transgender Equality also released their report of the 2015 U.S. Transgender Survey. With 27,715 respondents, it is the largest survey ever conducted among trans people in the United States. The survey was offered online in 2015 in both English and Spanish, and captured data from adults (18+) in all 50 states, Washington D.C., American Samoa, Guam, Puerto Rico, and U.S. military bases overseas. During the creation of the survey, many questions were adapted from pre-existing federal surveys, meaning that even beyond the benefit provided by the study’s huge sample size, the data is uniquely valuable for making direct comparisons between survey respondents and the general U.S. population.
The report is a few hundred pages long and includes thousands of data points, but some of the findings highlighted during the release event were:
- 46% of survey respondents had been verbally harassed in the past year because they were transgender, and 9% had been physically attacked. Among undocumented trans immigrants, the number experiencing physical attack rose to 24%.
- In the past year, 23% of respondents faced housing discrimination or instability, with 12% actually experiencing homelessness. Almost a third of all respondents had experienced homelessness in their lifetime. Among undocumented trans immigrants, almost half had experienced homelessness.
- Respondents had unemployment rates three times as high as the general U.S. population, and were twice as likely to be living in poverty. Among trans POC, the poverty rate was three times higher than the general U.S. population, and among disabled trans people, almost half were living in poverty.
- 40% of respondents had attempted suicide in their lifetime — a rate nine times higher than that of the general U.S. population. In the month preceding the survey, 39% of respondents reported experiencing serious psychological distress, based on the Kessler 6 Psychological Distress Scale.
- 1.4% of survey respondents were living with HIV (a rate five times higher than the U.S. population), but among Black trans women, the rate was 19%.
Said NCTE Executive Director Mara Keisling, “The survey’s a good reminder that there’s still a lot of work to be done. While there are so many good things to look at, so much progress being made, there are still tragedies and challenges happening every single day for trans people around the country. The policy stakes couldn’t be higher. We’ve always tried to be an extremely assertive policy advocacy organization, and there’s data in here that shows us some of the things we need to get into deeper and faster and better. We don’t have all the information yet about what the policy frontier looks like in the coming months, but we do know we have a tool now that shows lots of things that we need to be working on. This will help with that advocacy.”
What useful data sets have you come across in your activism?
Notes From A Queer Engineer is a recurring column with an expected periodicity of 14 days. The subject matter may not be explicitly queer, but the industrial engineer writing it sure is. This is a peek at the notes she’s been doodling in the margins.


