New Gallup Poll Answers the Question “How Gay Is Your State?”
In June 2012, Gallup, one of the world’s largest and most reputable polling companies, added the question “Do you, personally, identify as lesbian, gay, bisexual, or transgender?” to their Gallup Daily tracking poll. When they released the first batch of data in October 2012, it was already noteworthy for being the largest to date. Now, four months later, it’s nearly twice as big, having garnered over 200,000 responses from all across the country. The estimated proportion of LGBT citizens nationwide has stayed about the same — it’s now at 3.5%, up from 3.4% — but there is now enough data to come up with state-by-state percentages, too, as there were over 1,000 respondents in all but eight states. This is very exciting for everyone who likes numbers and trends, as well as those of us who like to stand in our local coffee shops and try to figure out the exact Queer Quotient.
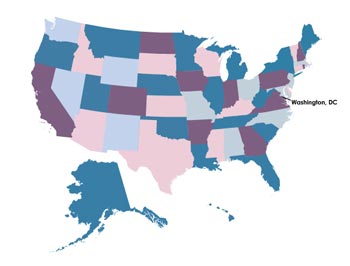
You can go here to find a state-by-state table and a fun mouseover map, but here are some vitals:
- Washington, D.C. has the highest reported proportion of LGBT people, a cool 10%. This is nearly twice as high as the runner-up, Hawaii, which reports 5.1%.
- The following eight: Vermont, Oregon, Maine, Rhode Island, Massachusetts, South Dakota, Nevada, and California.
- North Dakota is at the bottom of the chart, clocking in with 1.7%.
- If you take out D.C., the spread of percentages, from Hawaii at #2 to North Dakota at #50, is a mere 3.4%. As the analysis points out, this very small variation “may run counter to some stereotypes that portray the LGBT community as heavily grouped in certain states of the union,” such as urban areas.
- The highest red state on the list is South Dakota, at #8 (4.4%). The lowest blue state is Pennsylvania, at #43 (2.7%).

“I WAS TALKING ABOUT D.C. THE WHOLE TIME, GUYS” – KINSEY
Gallup has begun to crunch its new numbers with older ones, beginning by comparing LGBT presence to political ideology. Results are unsurprising: their 10 Most LGBT States list and their 10 Most Liberal States list have seven members in common; 10 Least LGBT States and Top 10 Conservative States have six. South Dakota is the only state that houses over 4% LGBT people and lacks anti-discrimination and partnership laws. They’re also trying to figure out why there’s any variation at all — do LGBT people move to more supportive areas, or are LGBT people in less supportive areas less likely to tell the truth to a telephone pollster? David Mariner, who runs the Center for the LGBT Community in D.C., thinks it’s the former, calling the study “a good indicator of where people feel comfortable living and where people want to live.” Dave Lanpher of Fargo, North Dakota’s Human Relations Commission, thinks it’s the latter, and suspects an undercount. The study’s founders, who are probably less biased, also lean towards the second explanation, as their report has also found that most LGBT people are also young, nonwhite, and female, three “groups with economic disadvantages that could limit their abilities to move.”
As we’ve discussed before, counting gays is problematic sociologically and philosophically. And even if, as study author Gary J. Gates argues, it’s still worth it, it’s pretty difficult logistically, too. We are a community that, generally speaking, does not enjoy neat little boxes of the confining or pencil-checking variety (of course, some of us do enjoy them, which makes us even more unboxable overall). Asking people whether they consider themselves L, G, B or T might leave out those who identify better with other letters. It also leaves out everyone who is uncomfortable sharing information about their sexuality. So a study like this is less a rack of hard data and more a representation of people who, in Gallup’s words, “publicly identify themselves as part of the LGBT community when asked in a survey context.”
“I’M SORRY BUT THAT’S BETWEEN ME AND MY SUPER-HOT GIRLFRIEND . . . WAIT, OOPS”
Still, it’s better than nothing. Immediate effects will include new potential pickup lines (“hey California girl, are you in the 4.0%? ‘Cause you’re lookin’ 100% good”), some nifty infographics, more fuel for the coast-vs-coast rivalry, and a zillion think pieces about why D.C. is so disproportionately gay (I blame the Washington Monument). Long-term, hopefully studies like this will lead to increased knowledge, more visibility, and challenges to old associations between “gay” and “urban” and “Northeast” and “West Coast.” Maybe they’ll finally even ask about us on the U.S. Census! Then we could REALLY start crunching some numbers and taking some names.