Hello, it’s me again and also — it’s you again! Or perhaps you’re brand new here in which case, here we are for the first time, what a pleasure. Welcome to this thing I started doing in 2016, during a time when nothing made sense to me except numbers and it turned out that wow, you really liked numbers, and that makes sense too. So I did it in 2017, a winter too dark to remember and then I did it in 2018 because listen I like to keep a good thing going. Now here I am in 2019, at the mercy of the universe, as we all are, you know? But we do have this: these numbers, the charts and graphs and lists of our lives like sand through the hourglass.
We’d like to politely request that you do not share any of these graphics outside of A+ and instead enjoy them only here on this page right now with us as a family! Okay? You might notice the graphs are cuter this year, that’s because Design Director Sarah edited them and made them pretty.
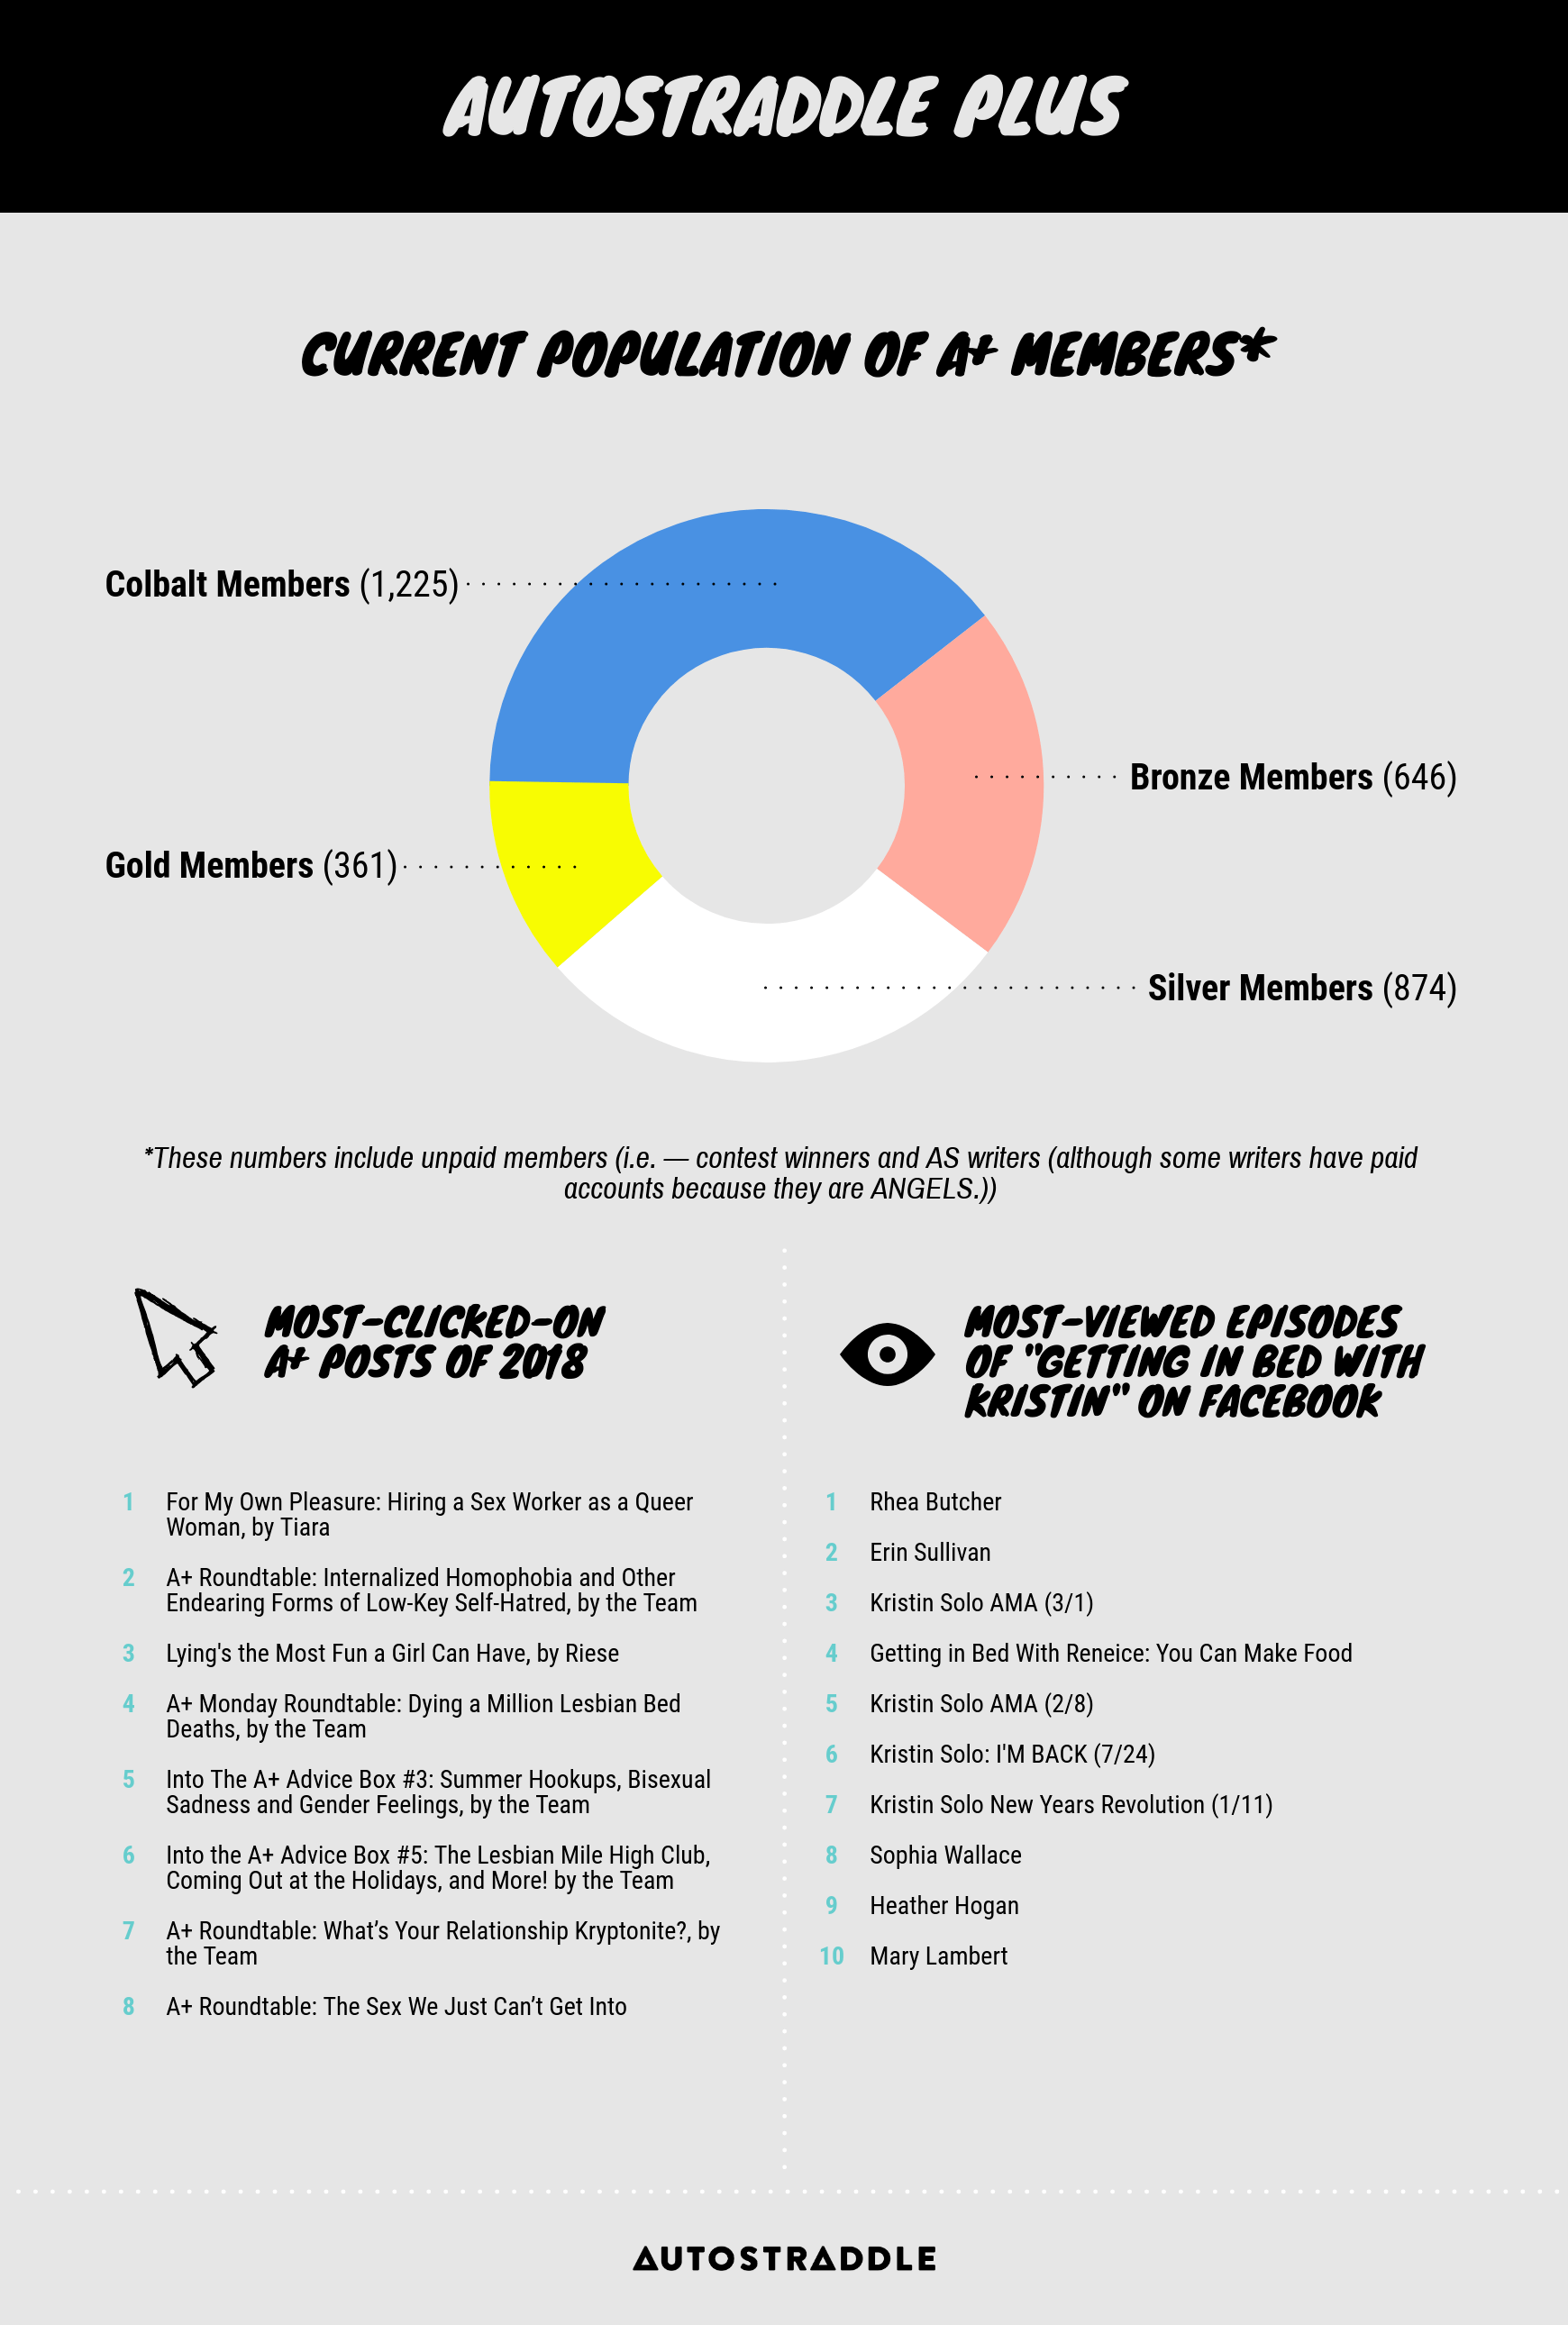
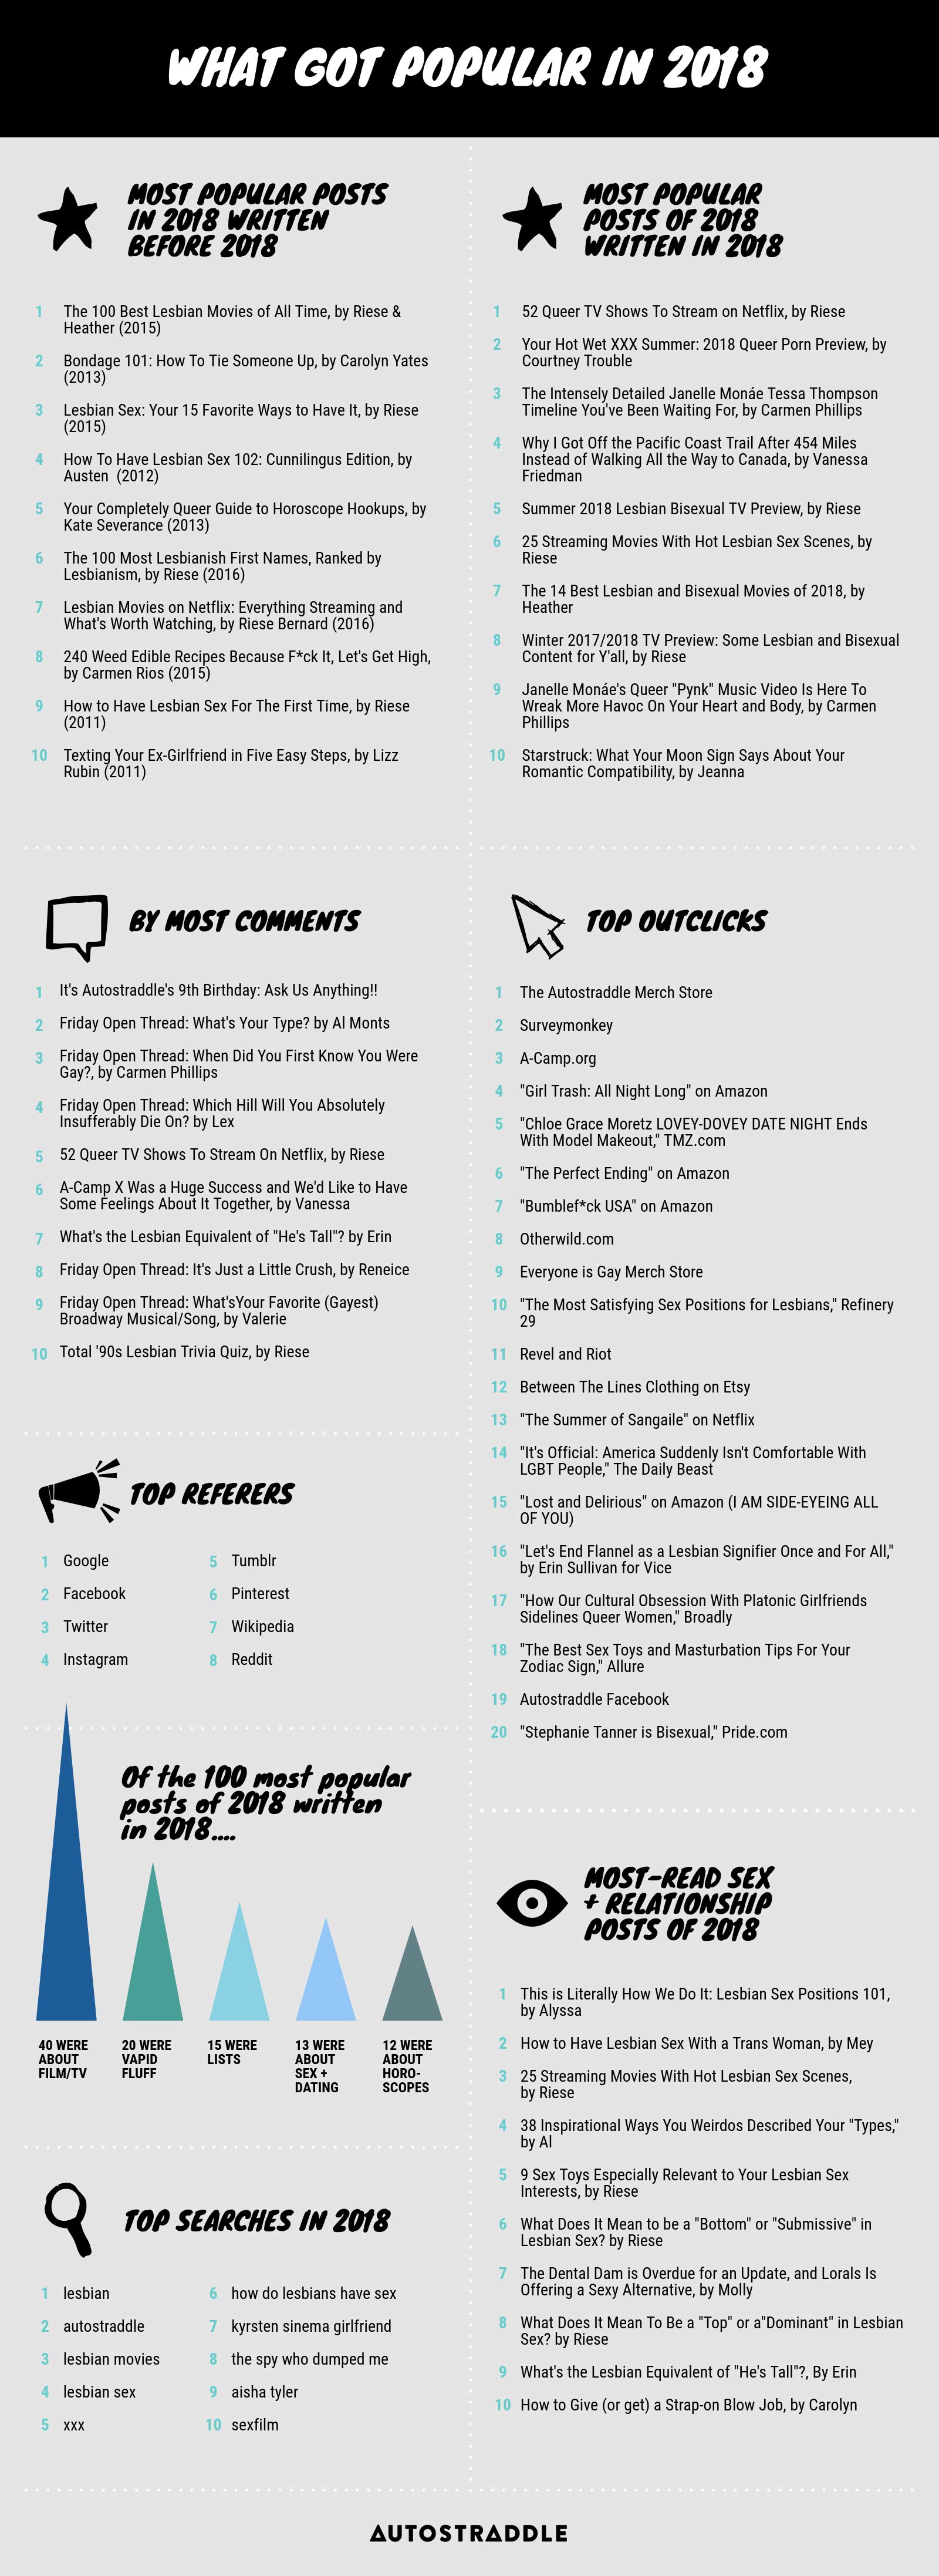
Most Popular Content of 2018
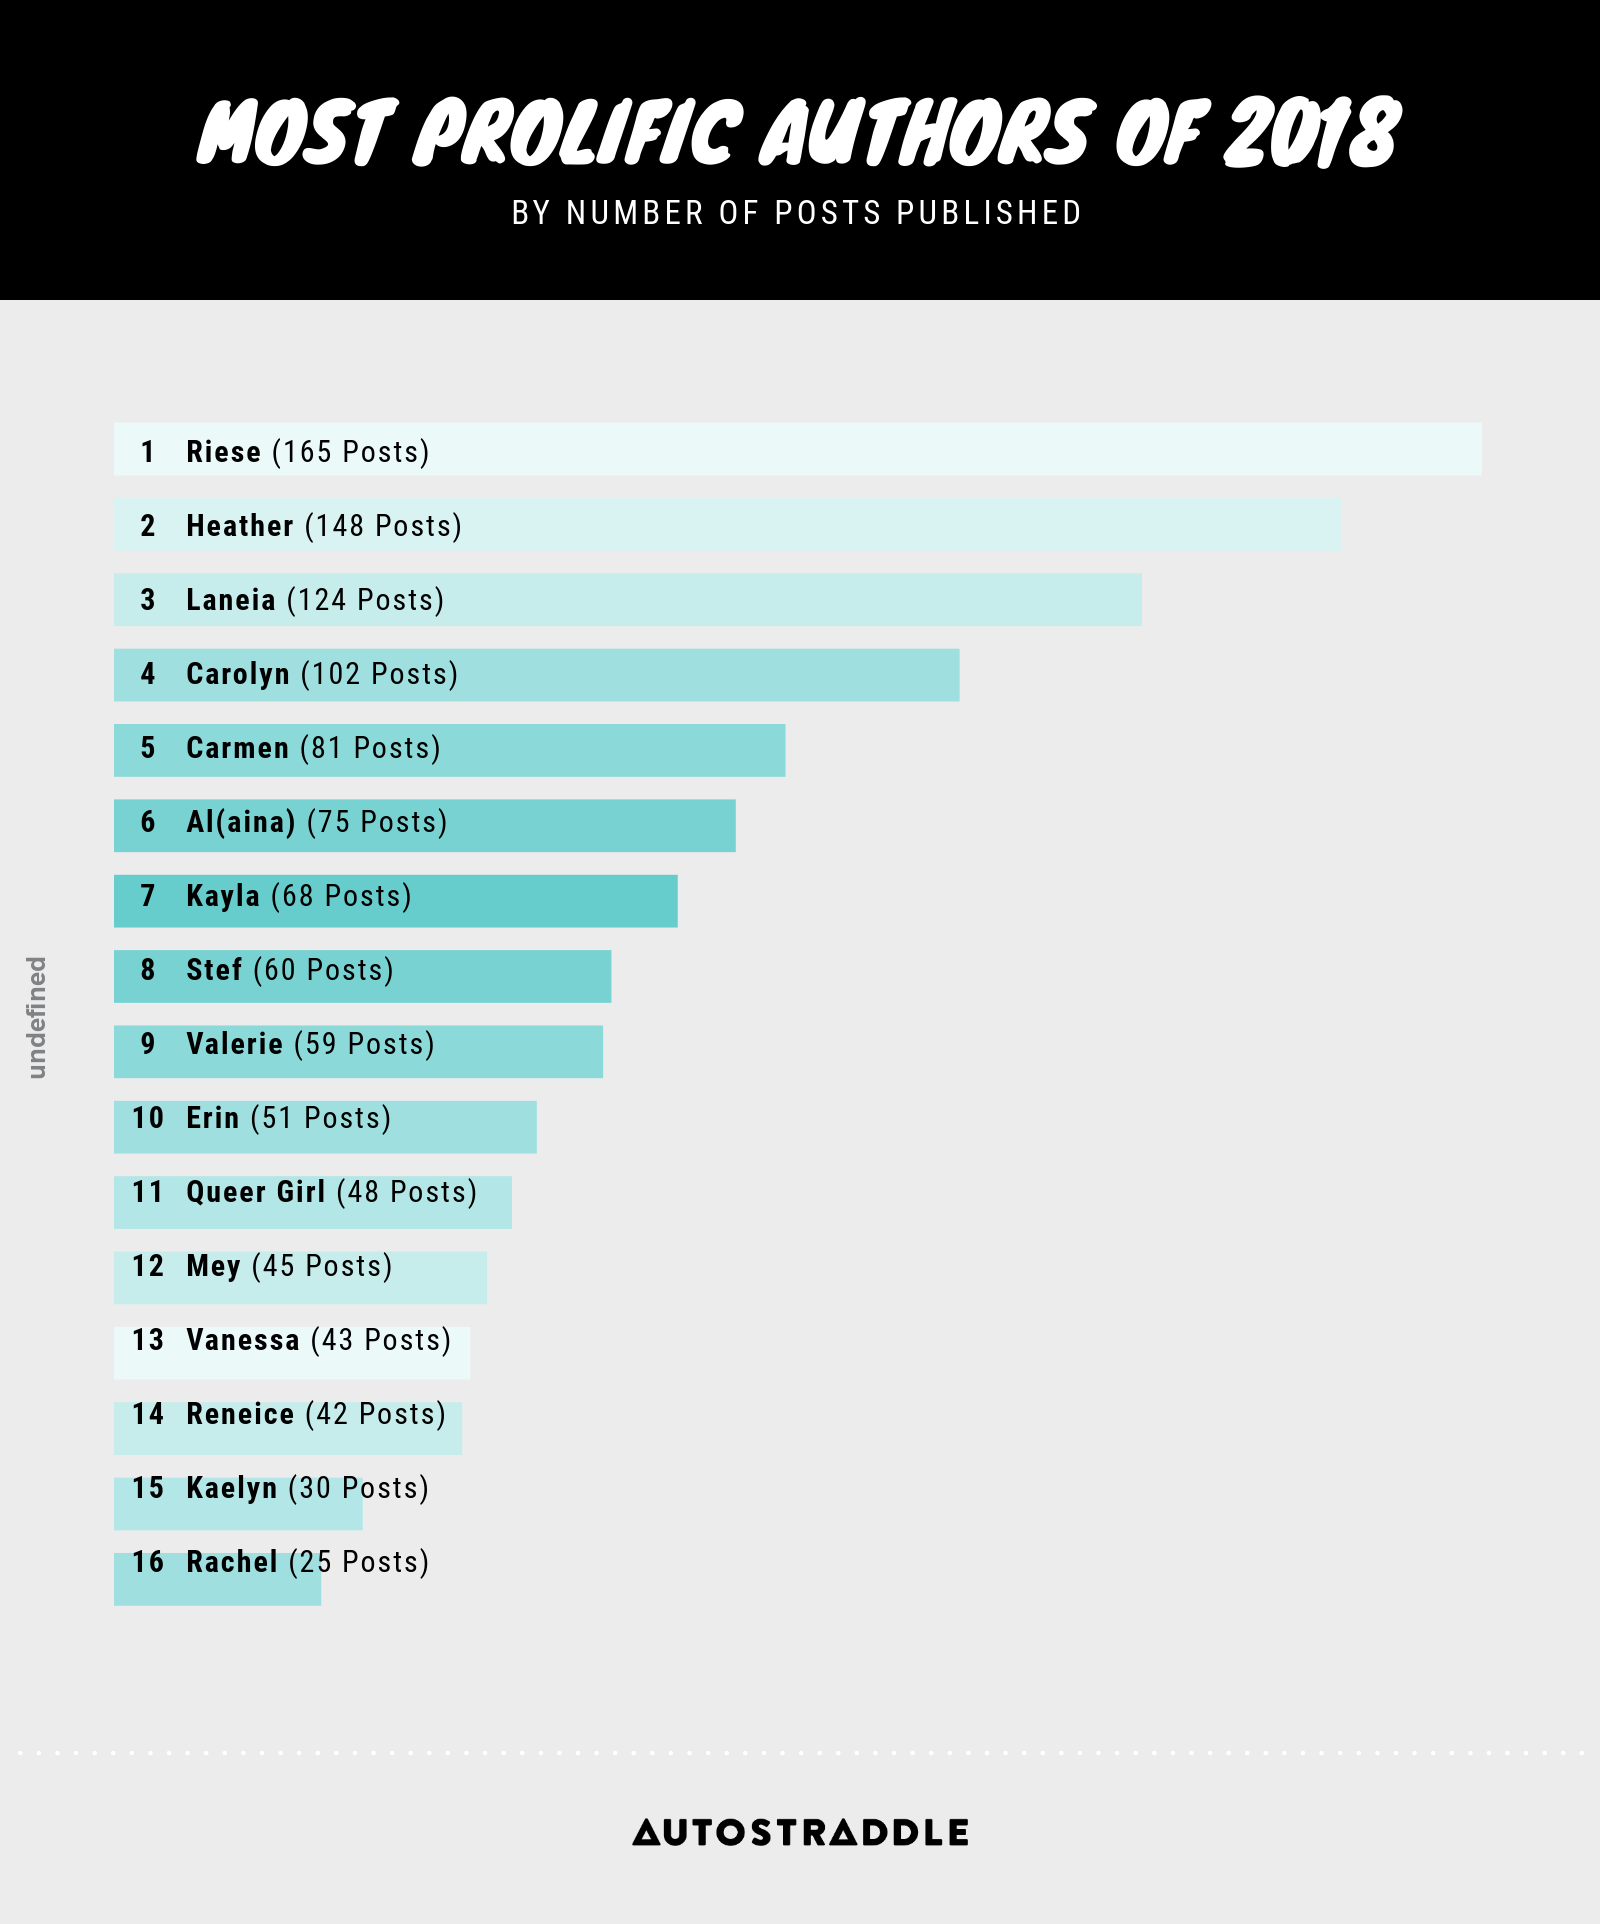
Who Wrote What
Another year, another opportunity for Heather to inch ever-closer to beating me for Most Posts. Although it bears mentioning that she also coordinates all the Boob(s) On Your Tubes and those are now attributed to the TV Team rather than her specifically. So I’m not sure if it’s totally fair to say that she did not beat me.
Money Money Money
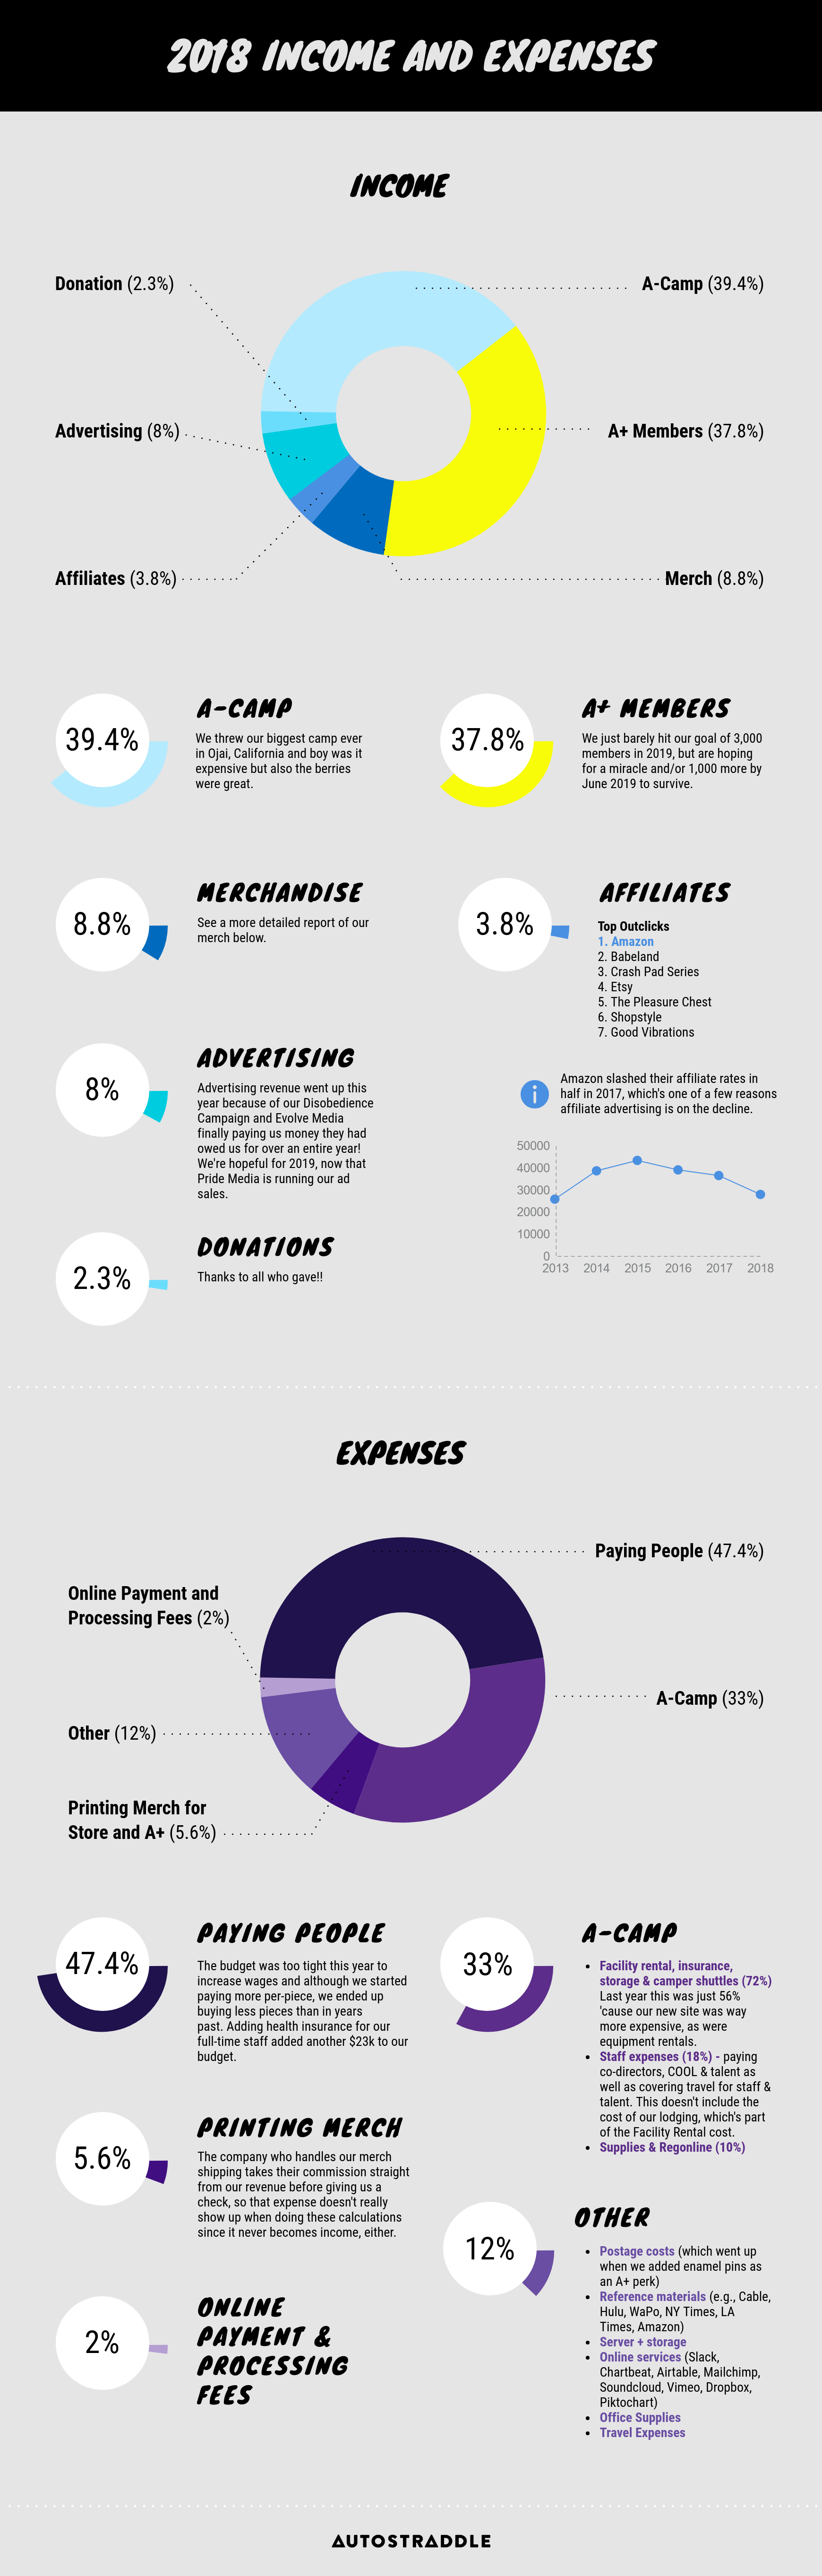
Income & Expenses
Last year I said “Our goal for this year is to add another full-time staff member,” and lo and behold, we achieved no such thing! We actually had to cut back what we spent in the editorial department, but also adding full health/dental/vision benefits for our employees was a significant add-on. We weren’t able to replace Subject Editors who had to leave for more financially beneficial pastures, either, so we definitely did not achieve that goal BUT who knows what this year will bring! The fact that it’s been broughten at all is ’cause of you. Last year, revenue and expenses went up at similar rates (around 7% – 8%). This year, our revenue went up 14%… but expenses went up 22%.
Merchandise
Doing this graph at the end of the year gives a strong advantage to merch released earlier in the year for the “New This Year” section. I realize this now, and will deeply consider it going forward.

You People